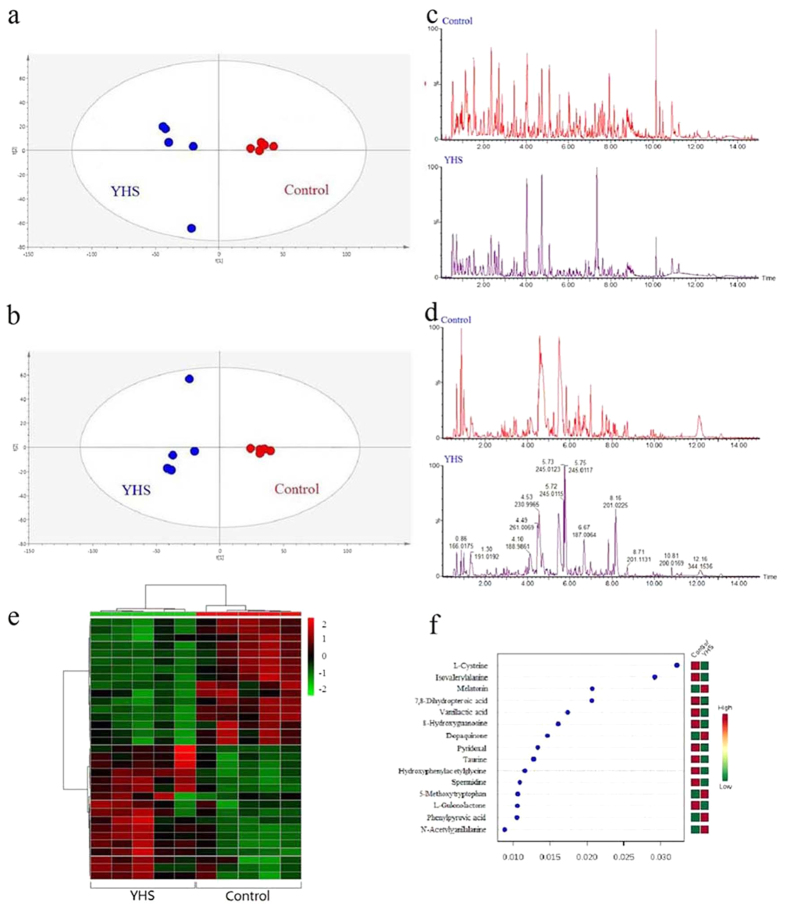
Figure 1. Pattern recognition analysis of the UPLC/MS spectra of urine samples.
( ) Control group and (
 ) YHS group in positive mode (a) and negative mode (b). Fingerprint of the control group and YHS group in positive mode (c) and negative model (d). Heat map visualization for YHS mice in positive mode and negative mode (e). The top 15 significant features of the metabolic markers based on the VIP projection (f).

