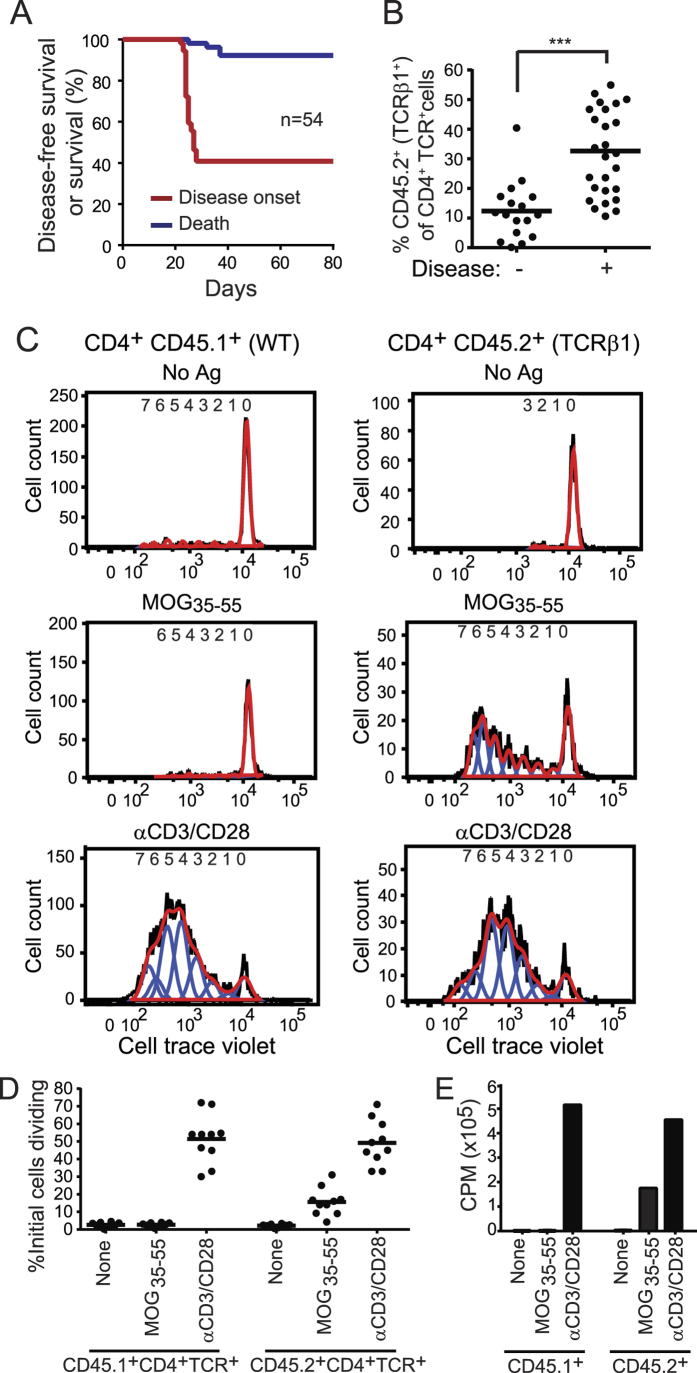
Figure 3. Unprimed T cells from disease-free TCRβ1 chimeric mice exhibit MOG responsiveness.
(A) Disease-free and overall survival of mice chimeric for WT (CD45.1+) and TCRβ1 (CD45.2+) T cells are plotted. (B) Peripheral blood samples were collected at day 28. The percent of CD4+TCR+CD45.2+ (TCRβ1+) T cells among total CD4+TCR+ T cells in chimeric mice developing or not developing EAE is plotted. (C) Ex vivo proliferation of CD4+CD45.1+ (WT) and CD4+CD45.2+ (TCRβ1+) T cells from a representative 8 wk disease-free retrogenic mouse was measured by CellTrace Violet dilution 72 h after stimulation. Plots show total cell counts (black line), cell count data fit to proliferation model (red line), and individual proliferative generations (blue lines). (D) Summary data from T cells from individual mice stimulated as in (C). The magnitude of each division peak was divided by 2n, where n = division peak number, to estimate numbers of parental cells whose progeny populated an individual peak. (E) CD4+TCR+CD45.2+ (TCRβ1+) and CD4+TCR+CD45.1+ (WT) T cells were sorted from 8 wk chimeric mice without current or historical signs of EAE. The cells were stimulated as indicated and proliferation measured on day 3 by 3H-thymidine incorporation. ***p ≤ 0.001.

