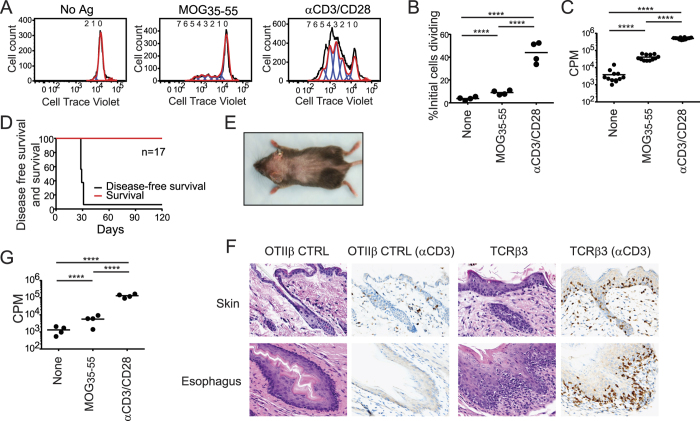
Figure 4. Heightened public TCRβ autoreactivity.
(A) Proliferation of T cells from unprimed and disease-free retrogenic TCRβ4 mice was measured by dye dilution 72 h after stimulation as indicated. (B) The percent of initial TCRβ4 cells dividing in response to the indicated stimulus was calculated by dividing each division peak by 2n, where n = division number, to estimate initial cell numbers forming each peak. (C) Proliferative response of purified TCRβ4 T cells measured using 3H-thymidine incorporation. Circles indicate means of triplicates from individual mice. (D) Kaplan Meier analysis of alopecia-free and overall survival in TCRβ3 retrogenic mice. (E) The dorsal surface of a representative TCRβ3 mouse demonstrates extensive alopecia areata. (F) Premature catagen and inflammatory infiltrates in the follicular and interfollicular epidermis, and inflammatory infiltrates associated with diffuse thickening and hypercellularity of the squamous esophageal epithelium of a day 30 TCRβ3 mouse. Immunohistochemistry for CD3+ cells demonstrates markedly increased T cell numbers compared with a healthy control (CTRL) OTIIβ retrogenic mouse. (G) T cells from TCRβ7 retrogenic mice were isolated and stimulated as indicated. Proliferative response was measured at 72 h by 3H-thymidine incorporation. Circles indicate means of triplicates from individual mice. ****p ≤ 0.0001.

