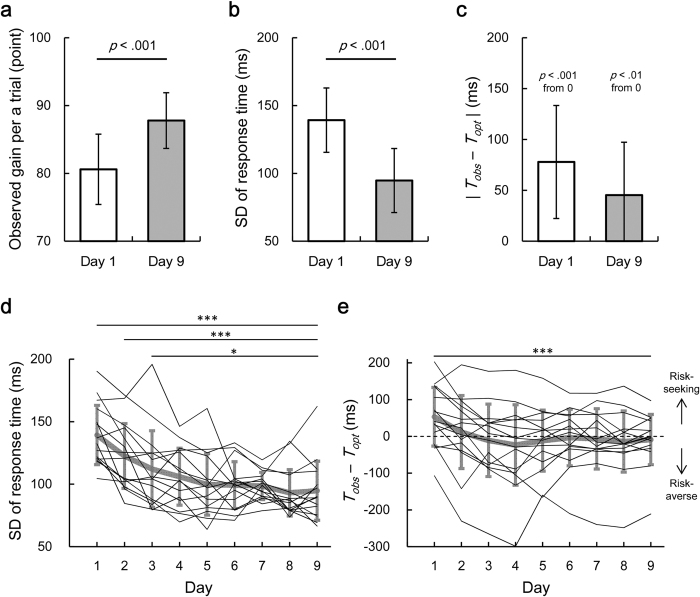
Figure 3. Effect of learning on performance indexes.
(a) Observed gain per trial. (b) Standard deviation (SD) of the response time. (c) Absolute difference between the observed mean response time Tobs and the optimal mean response time Topt. The average value across the participants is plotted in each index, and the error bars indicate the standard deviation. The observed gain per trial and the SD of the response time was significantly improved from day 1 to day 9. The absolute difference between Tobs and Topt was significantly different from 0 (risk-neutrality value) both on day 1 and day 9. Thus, the participants still behaved sub-optimally on the last day. (d,e) Time series of the SD of response time (d) and the difference between Tobs and Topt (e), shown for all the participants. The thin black lines represent the average value on a day (5 blocks) for each participant. Intra-personal errors are omitted for clarity. The thick grey line represents the average value across the participants and the error bars indicate the standard deviation. *indicates p < 0.05 and ***indicates p < 0.001, compared to day 9 (Dunnett’s post-hoc test following one-way repeated measures ANOVA).

