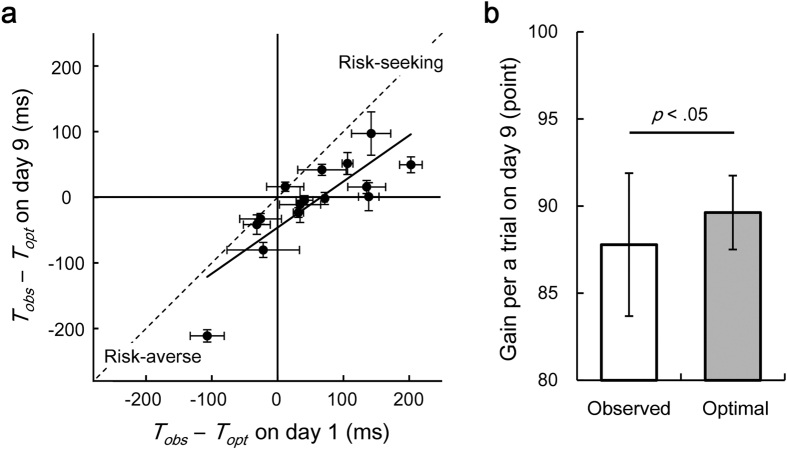
Figure 4. Suboptimal behaviour was preserved after the practice.
(a) The average difference between the observed mean response time Tobs and the optimal mean response time Topt on day 1 (5 blocks) is plotted against that on day 9 for all the participants. Horizontal and vertical error bars indicate the standard errors of the mean within day 1 and day 9, respectively. Data points that fall in the top right quadrant correspond to the risk-seeking to risk-seeking strategy. Data points that fall in the bottom left quadrant correspond to the risk-averse to the risk-averse strategy. A slope of 0.70 in a regression line suggests that the participants kept risk-seeking or risk-averse strategy between day 1 and day 9. (b) The suboptimal strategy was still used on the last day. On day 9, there was a significant difference between the observed gain and the optimal gain per trial. The average value across the participants and the standard deviation is plotted.

