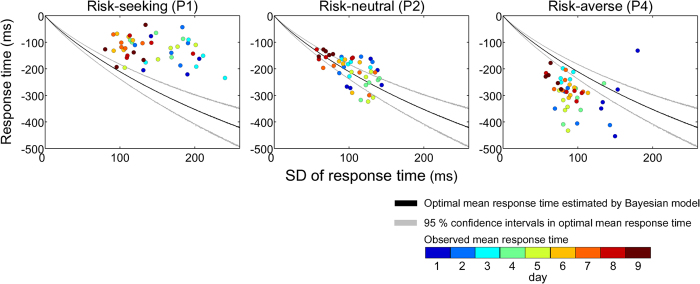
Figure 6. Inter-personal differences in strategy under risk.
Each panel shows a participant classified as risk-averse, risk-neutral, and risk-seeking. In each panel, the observed mean response times for all 45 blocks were plotted against the SD of the response time. The colour scale of the circles indicates the day of the measurements. Black curves indicate the optimal mean response time calculated by the Bayesian model (Equation 2). Grey curves show the 95% confidence intervals of the optimal mean response times after 3000 bootstrap replications. See Methods and Ota et al.20 for the details of the calculations. The risk-seeking participant (left panel) responded closer to the reference time than the optimal time, and the risk-averse participant (right panel) responded further from the reference time than the optimal time. The risk-neutral participant (middle panel) could appropriately increase their mean response time with a practice-induced decrease in the response variance. For the results of the other participants, see Supplementary Fig. 2.

