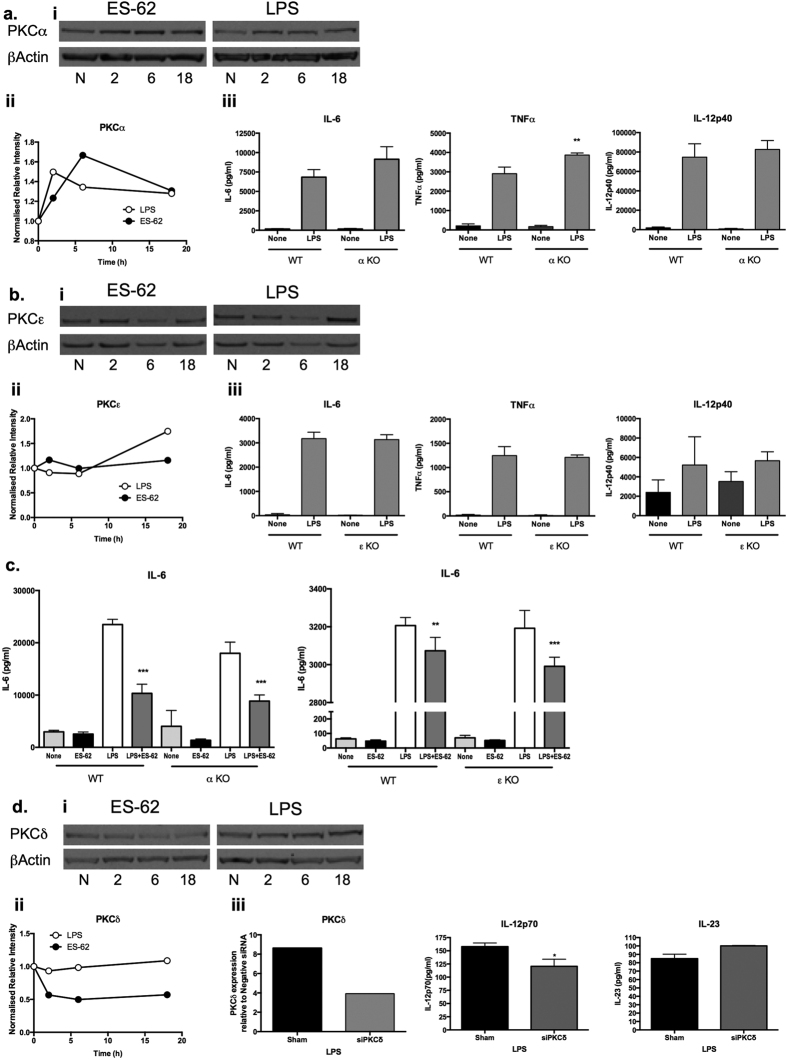
Figure 3. ES-62 selectively downregulates PKCδ expression in DCs.
BmDCs were treated as described in Fig. 1 for up to 18 h with ES-62, LPS or incubated in medium alone (N, at 18 h time point) and analysed for PKC-α (ai,ii), PKC-ε (bi,ii) or PKC-δ (di,ii) expression by Western blotting and quantitated relative to β-Actin and normalised to the 18 h medium control (N) from single experiments. Supporting the reproducibility of these findings, data normalised X-fold to the medium control from all the independent 18 h time-point Western blotting experiments performed in this study (other data not shown apart from relevant PKC-δ samples presented in Figs 4 and 7) are summarised here, expressed as mean values ± SEM where n = number of independent experiments, except in the case of PKC-α, where data are from 2 independent experiments and expressed as mean values. Thus for PKC-α: ES-62–2.17; LPS–1.28; PKC-ε: ES-62–0.77 ± 0.18, n = 4; LPS–1.56 ± 0.16, n = 4; PKC-δ: ES-62–0.56 ± 0.04, n = 12 p < 0.001; LPS–1.05 ± 0.13, n = 10. LPS-mediated cytokine release was measured by ELISA from DCs derived from matched WT or PKC-α (aiii, c) and PKC-ε (biii, c) mice. The data in aiii and biii are means ± SD, n = 3 from single experiments representative of at least 3 independent experiments whilst in c, the data are presented as means ± SD, n = 3 from single experiments. In diii, WT bmDCs were treated with control or PKC-δ-specific siRNA and then levels of PKC-δ expression determined by FACE assay and IL-12p70 or IL-23 measured by ELISA. In an independent experiment, treatment of DCs with siPKC-δ also suppressed LPS-stimulated IL-6 production by some 15% relative to the levels observed in the sham-treated control cells. Where indicated, *p < 0.05 **p < 0.01 and ***p < 0.001.

