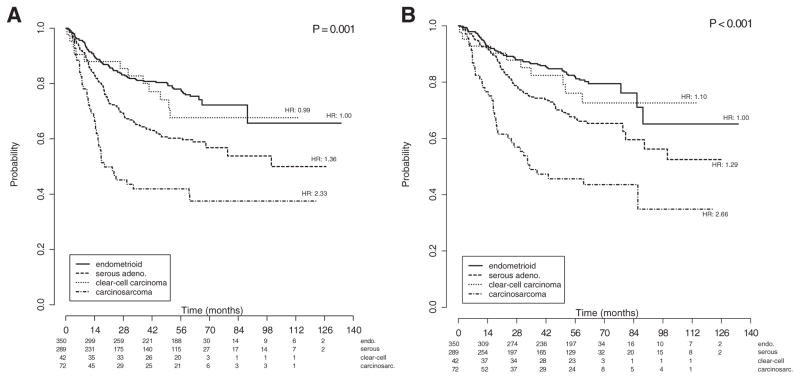
Fig. 1.
a: Kaplan–Meier curves of progression-free survival for all patients, stratified by histology group. Figures below months indicate the numbers of patients at risk. The p-value is from the Wald test to compare hazard ratios between the histology subgroups in the multivariate model. Legend: endo: grade 3 endometrioid; other: USC, CCC and carcinosarcoma. b: Kaplan–Meier curves of overall survival for all patients, stratified by histology group. Figures below months indicate the numbers of patients at risk. The p-value is from the Wald test to compare hazard ratios between the histology subgroups in the multivariate model. Legend: endo: grade 3 endometrioid; other: USC, CCC and carcinosarcoma.

