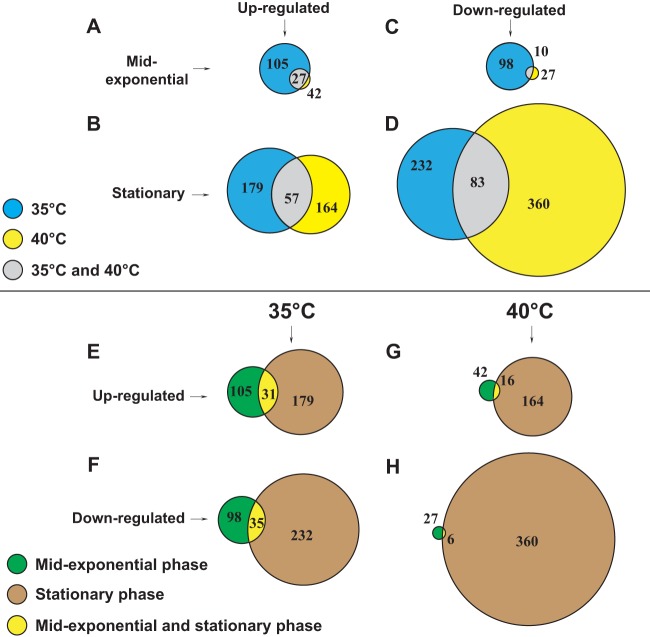
FIG 3.
Area-proportional Venn diagrams representing differentially expressed genes. (A to D) Genes differentially expressed at 35°C and 40°C. Common genes differentially expressed at both growth temperatures are also depicted. (A) Genes upregulated during mid-exponential phase. (B) Genes upregulated during stationary phase. (C) Genes downregulated during mid-exponential phase. (D) Genes downregulated during stationary phase. (E to H) Genes differentially expressed during mid-exponential and stationary phases. Common genes differentially expressed during both phases of growth are also depicted (E) Genes upregulated at 35°C. (F) Genes downregulated at 35°C. (G) Genes upregulated at 40°C. (H) Genes downregulated at 40°C.

