FIG 2.
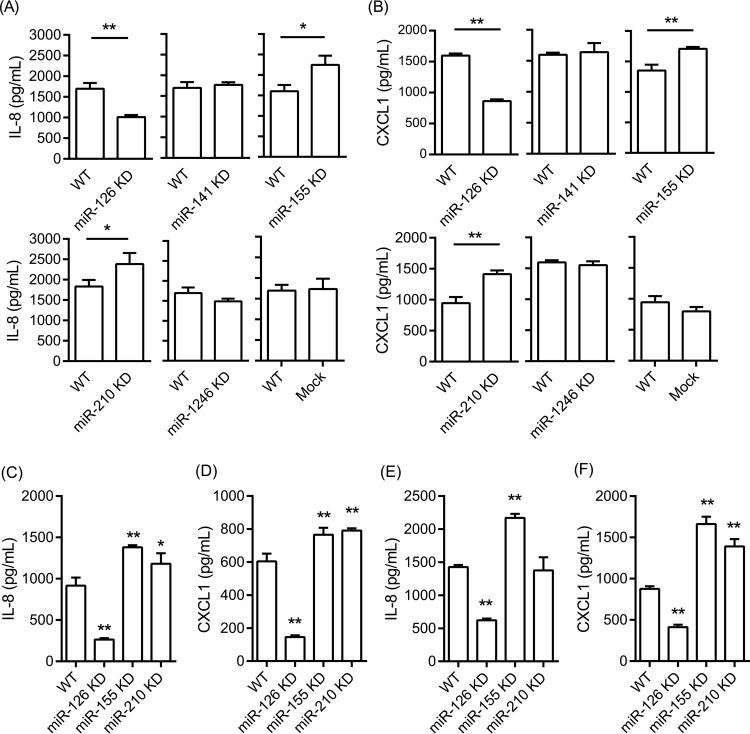
Expression of IL-8 (A, C, and E) and CXCL1 (B, D, and F) assessed by ELISA after stimulation with heat-killed WT P. gingivalis (A and B), live P. gingivalis mutant KDP128 (C and D), and live A. actinomycetemcomitans (E and F), at a multiplicity of infection (MOI) of 100 for 6 h. Bars represent mean values and standard deviations based on triplicate experiments. Asterisks indicate statistically significant differences between WT and miRNA KD cells (*, P < 0.05; **, P < 0.01).

