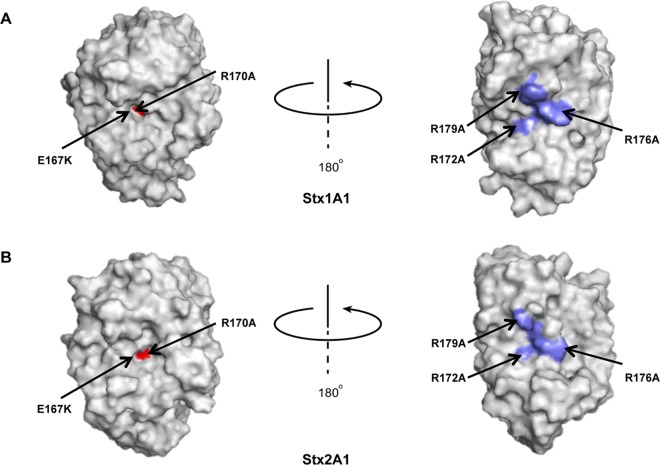
FIG 1.
Crystallographic structures of Stx1A1 and Stx2A1 showing the active site and the distal face of the active site. The A1 subunits of Shiga toxin and Shiga toxin 2 were modeled from the Protein Data Bank ID 1DM0 (Shiga toxin) and 1R4P (Shiga toxin 2). The active site of Stx1A1 (red) is more embedded (A) than the active site of Stx2A1 (B). Rotation about the y axis by approximately 180° reveals the conserved arginines (blue) in Stx1A1 (A) and in Stx2A1 (B).

