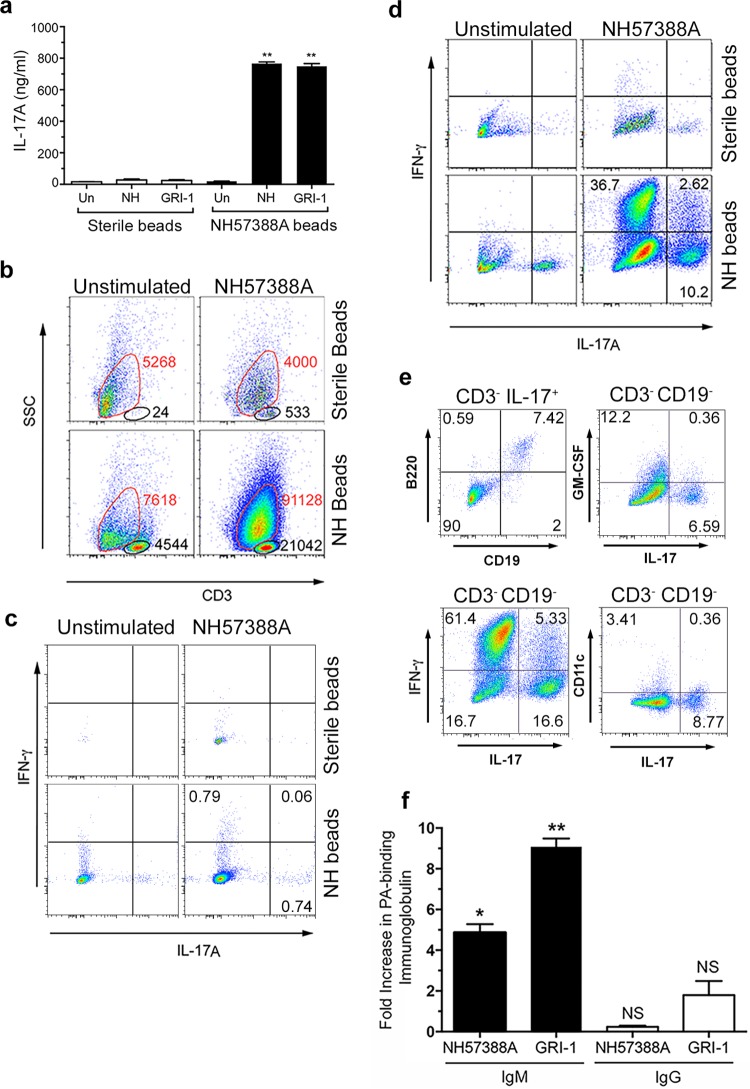
FIG 2.
Immune responses following P. aeruginosa infection. Two weeks after infection, mediastinal lymph node cells from WT mice treated as indicated were stimulated ex vivo with heat-killed P. aeruginosa strains (MOI of 30) or left unstimulated for 3 days. (a) Levels of IL-17A secretion are shown; bars show mean values and error bars show SEM. **, significantly different from sterile beads at a P value of <0.01 by t test; Un, unstimulated; NH, NH57388A. Representative results from three separate experiments are shown. (b) Flow cytometry results for stimulated (3 days) mediastinal lymph node cells stained as shown. The CD3lo-int populations are outlined in red, and the CD3int-hi populations are outlined in black. The total number of cells recovered in each gate is shown next to the gate. SSC, side scatter. (c to e) Flow cytometry of lymph node cells as described in the legend to panel B except that cells were gated on the CD3int-hi population (c), the CD3lo-int population (d), or as indicated (e). The percentage of cells in each quadrant is shown. (f) Fold increases in P. aeruginosa-binding IgM and IgG produced by mediastinal lymph node cells from infected animals restimulated with P. aeruginosa strains ex vivo compared to the levels produced by unstimulated cells. Columns represent mean values for triplicate wells; error bars show SEM. Columns were compared to a theoretical mean of 1.0 by Student's t test. NS, nonsignificant; *, P < 0.05; **, P < 0.01.

