FIG 3.
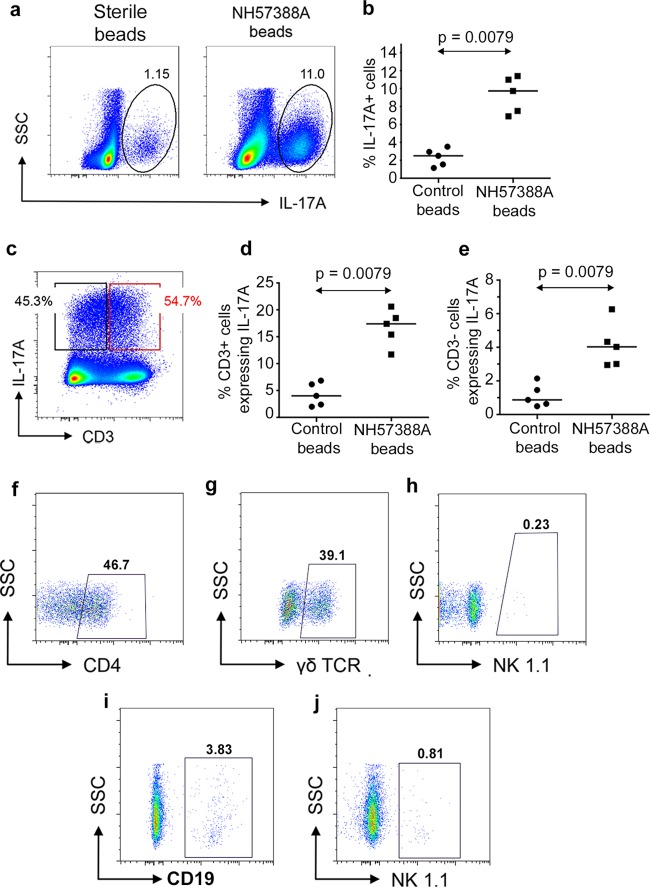
Lung parenchymal responses to P. aeruginosa infection. (a) Representative intracellular expression of IL-17A in lung parenchymal cells 2 weeks following instillation of sterile or P. aeruginosa-laden (strain NH57388A) beads. Numbers show percentages of total cells in ringed areas. (b) Percentages of total lung parenchymal cells expressing IL-17A 2 weeks after introduction of sterile or P. aeruginosa-laden beads. Each symbol represents an individual animal; lines show median values. P value was determined by Mann-Whitney test. (c) Representative expression of intracellular IL-17A in CD3+ and CD3− populations in lungs 2 weeks following P. aeruginosa infection as assessed by flow cytometry. (d, e) Data are as described in the legend to panel B but show the percentages of CD3+ (d) and CD3− (e) cells expressing intracellular IL-17A. (f to h) Flow cytometry results for CD3+ IL-17A+ cells expressing the indicated markers; boxed areas are deemed positive relative to results for isotype controls. Figures show percentages of the total CD3+ IL-17A+ population expressing the indicated markers. (i, j) Data are as described for panels F to H but with gating on CD3− IL-17A+ cells.

