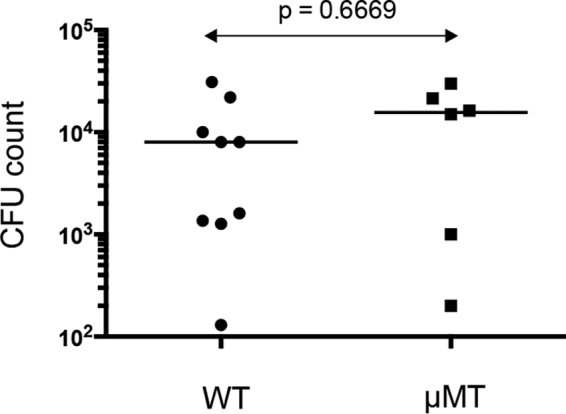
FIG 5.

Bacterial counts in WT and μMT mice following infection. Animals were infected with the NH57388A strain. Each symbol represents the result for an individual animal; lines indicate median values. P value for comparison between the groups was determined by Mann Whitney test.
