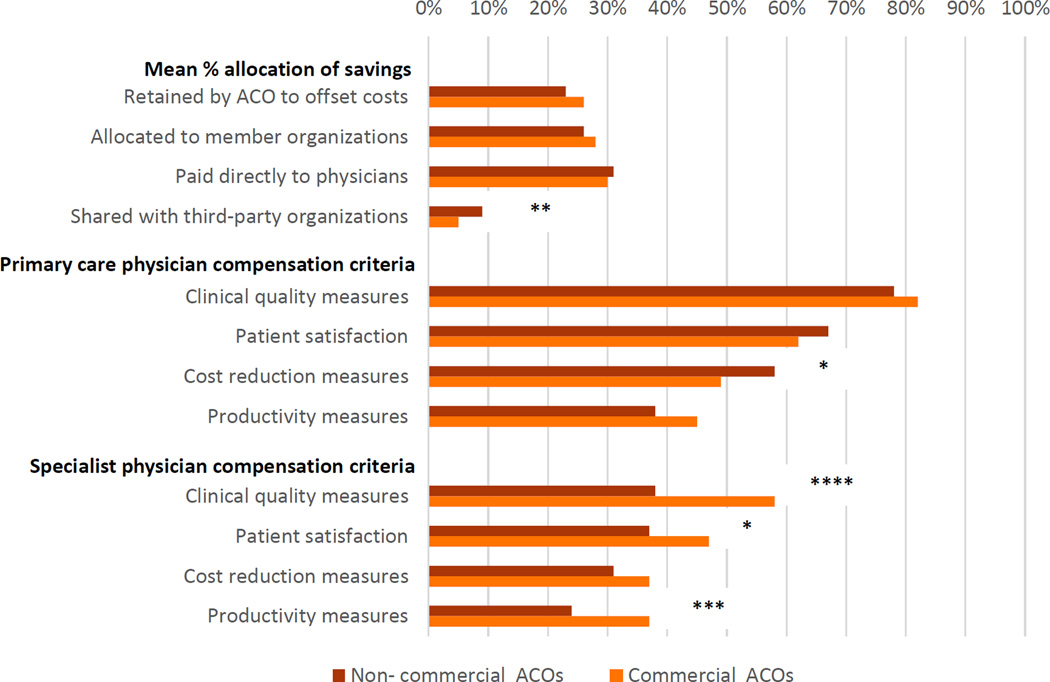
EXHIBIT 2.
Compensation processes for providers in accountable care organizations (ACOs) 2012–15, by commercial contract status
Source/Notes: SOURCE Authors’ analysis of data for 2012–15 from the National Survey of Accountable Care Organizations. NOTES Complete data including numerators and denominators for each question and additional survey questions analyzed that are not shown in the exhibit [please provide] are available in Appendix Exhibit A3-1 (see Note 14 in text). The data on mean percentage allocation of savings applies only to those ACOs with a savings distribution plan in place. *p < 0.10 **p < 0.05 ***p < 0.01 ****p < 0.001

