
Figure 1.
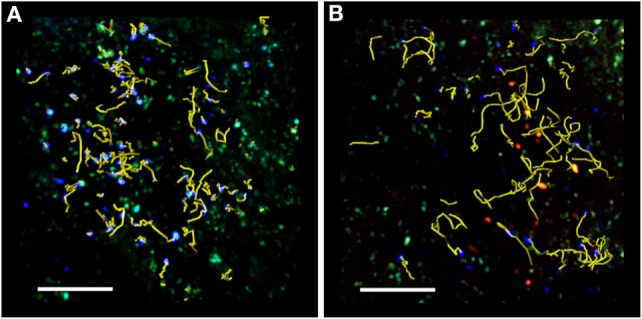
TPLSM imaging of an exposed lymph node after MOG35–55 immunization. Representative image of autoreactive T cells (blue) showing motility in the absence (A) or presence (B) of exogenous transplanted Treg cells (red). TPLSM was performed using MHC-II-GFP transgenic mice to visualize APCs (green). For an intuitive assessment of cell motility, yellow cell tracks are displayed graphically to indicate the progression of naïve T cell movement during the imaging period. The resulting positional information in four dimensions (xyz coordinates and time) is the basis for all subsequent computational analysis. Two-photon multidimensional data analysis parameters revealed that during MOG35–55 immunization, Treg cells modify the behavior of autoreactive T cells, increasing their motility and reducing their contact time with APCs in the peripheral LNs. Both figures are original. Scale bar = 100 micron.