
Figure 3.
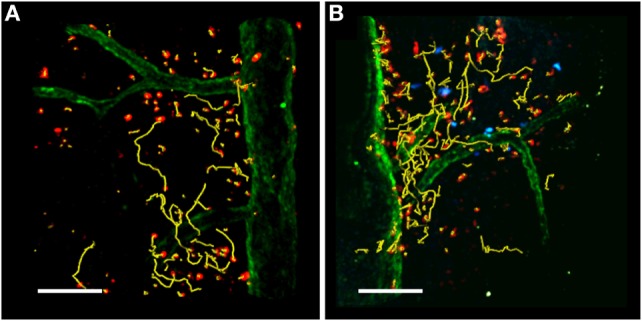
TPLSM imaging of the exposed spinal cord after MOG35–55 immunization. TPLSM representative dynamics (yellow tracks) of autoreactive Th1 cells (red) injected into C57Bl/6 EAE mice in the absence (A) or presence (B) of exogenous transplanted Treg cells (blue). Spinal cord vessels (green) were labeled by the systemic injection of 525 nm non-targeted quantum dots. All figures are original. Scale bar = 100 micron.