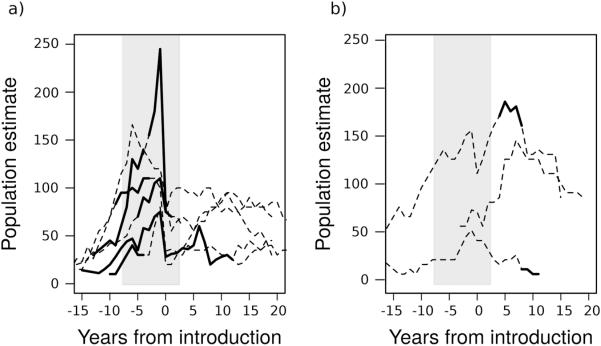
Figure 2. Change-points in complete ewe count trajectories.
Populations are aligned so that the first year of documented pneumonia is defined to be zero such that all negative years are disease-free. The grey shaded region showed the 95% posterior credible intervals on the mean change-point calculated across all populations. Solid black sections of the individual trajectories show 95% posterior credible intervals on that particular trajectory's change-point. (a) Trajectories1 for all populations whose individual change-points fell within the 95% posterior credible interval for the mean change-point. (b) Three populations' individual 95% change-point credible intervals fell entirely outside the 95% posterior credible interval for the mean change-point.
1The highest peak to trough includes removal of 72 sheep (43% of estimated mortalities) during the outbreak, but removing that trajectory had negligible effects on posterior estimates.

