-
A
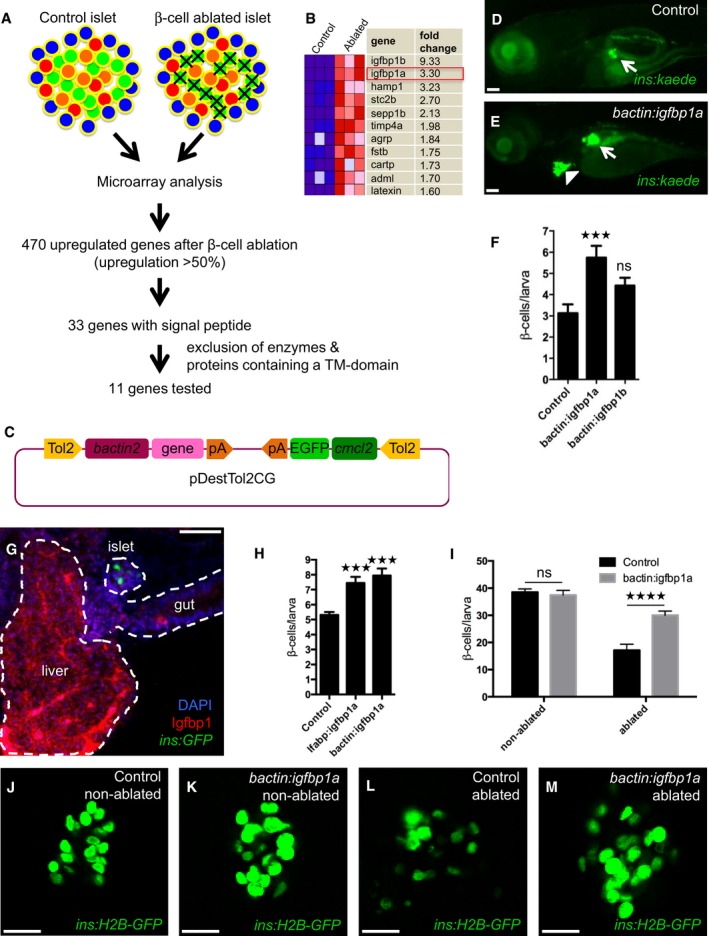
Schema of the analysis of gene expression in islets isolated from control larvae and larvae subjected to β‐cell ablation. β cells were ablated by exposing nitroreductase (NTR)‐expressing transgenic larvae to metronidazole (MTZ) from 3 to 4 dpf. Islets were then isolated, and their RNA extracted and analyzed by microarray. Out of the 470 genes that were upregulated more than 50%, 33 genes encoded proteins that harbored a signal peptide for secretion (according to the algorithm of SignalP). Excluding genes that encode enzymes or proteins with a transmembrane (TM) domain, we selected 11 genes for overexpression studies in zebrafish larvae (C–E).
-
B
Microarray heat map showing the upregulation in expression of the 11 candidate genes in β‐cell‐ablated versus control islets. Igfbp1a and b were the genes whose expression increased the most after β‐cell ablation.
-
C
Schema of the construct used for overexpression of the candidate genes (under the control of the beta‐actin promoter), and expression of GFP in the heart (as an internal control for genomic integration).
-
D, E
Representative images at 6 dpf of Tg(ins:kaede);Tg(ins:CFP‐NTR) transgenic larvae that had been injected at the 1–2 cell stage with transposase mRNA (control) or transposase mRNA + bactin:igfbp1a (bactin:igfbp1a), subjected to β‐cell ablation by metronidazole (MTZ) during 3–4 dpf, and subsequently allowed to regenerate for 2 days. The GFP+ heart (arrowhead) visualizes successful integration of the construct. Islets are indicated by white arrows. Scale bars: 100 μm.
-
F
Quantification of β‐cell regeneration at 6 dpf in control (n = 23), bactin:igfbp1a‐overexpressing (n = 13), and bactin:igfbp1b‐overexpressing (n = 8) Tg(ins:kaede);Tg(ins:CFP‐NTR) larvae; ***P = 0.0002, ns = non‐significant (P = 0.3106).
-
G
Immunohistochemistry showing Igfbp1 protein expression in 6 dpf Tg(ins:GFP) following β‐cell ablation between 3 and 4 dpf. Scale bar: 50 μm.
-
H
Both liver‐specific (lfabp promoter; n = 46) and widespread (bactin promoter; n = 18) overexpression of igfbp1a increase β‐cell regeneration when compared to control (n = 77); ***P < 0.001.
-
I–M
Quantification of β cells with or without β‐cell ablation and igfbp1a overexpression by confocal microscopy, which detects even weakly insulin‐expressing β cells; ****P < 0.0001. Scale bars: 15 μm.
Data information: Results are presented as mean values ± SEM and analyzed with one‐way ANOVA (F, H) or two‐way ANOVA (I). See also Fig
.