-
A–C
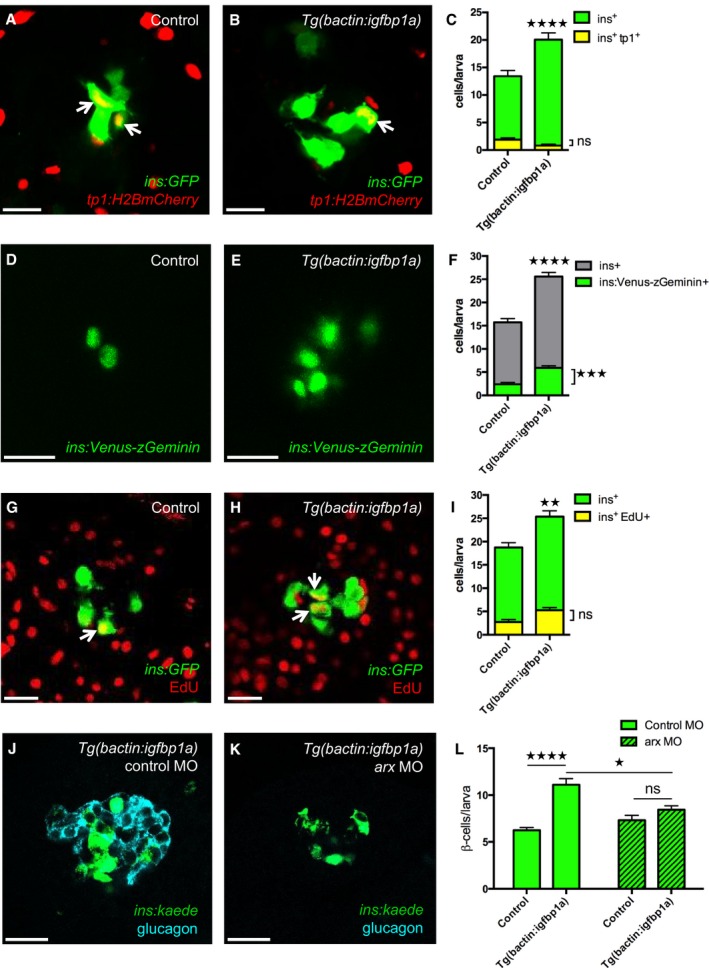
Tg(ins:GFP);Tg(tp1:H2B‐mCherry);Tg(ins:Flag‐NTR) transgenics, with or without Tg(bactin:igfbp1a), were treated with MTZ from 3 to 4 dpf to ablate the β cells and were then allowed to regenerate from 4 to 6 dpf. Representative confocal images at 6 dpf of control (A) and Tg(bactin:igfbp1a) (B) larvae showing a modest number of ins
+
tp1
+ co‐expressing cells, indicated by arrows, after 2 days of regeneration. Scale bars: 15 μm. (C) Quantification of the total number of β cells (green bars) at 6 dpf, and of β cells expressing Tg(tp1:H2B‐mCherry), that is, of ductal origin (yellow bars). ****P < 0.0001, ns= non‐significant. n = 23 larvae in the control group, n = 17 larvae in the Tg(bactin:igfbp1a) group.
-
D–F
Tg(ins:Venus‐zGeminin) was examined in control and Tg(bactin:igfbp1a) larvae at 6 dpf, after β‐cell ablation 3–4 dpf by using Tg(ins:Flag‐NTR). Representative confocal images (D, E) at 6 dpf of control and Tg(bactin:igfbp1a) larvae showing cell cycle activation of β cells in green. Scale bars: 15 μm. (F) Quantification of the total number of β cells with activated cell cycle at 6 dpf, ***P < 0.001, n = 32 larvae in the control group, n = 41 larvae in the Tg(bactin:igfbp1a) group. The number of β cells with activated cell cycle is displayed together with the total number of β cells in experiments with the same setup, ****P < 0.0001. n = 39 larvae in the control group, n = 33 larvae in the Tg(bactin:igfbp1a) group.
-
G–I
EdU was used as a marker for cell cycle progression. Tg(ins:H2B‐GFP);Tg(ins:Flag‐NTR) transgenics, with or without Tg(bactin:igfbp1a), were treated with MTZ from 3 to 4 dpf to ablate their β cells, and subsequently incubated with EdU during regeneration from 4 to 6 dpf. Representative confocal images (G, H) at 6 dpf of control and Tg(bactin:igfbp1a) larvae showing β cells in green and the β cells that had incorporated EdU in yellow (green and red overlap; arrowheads). Scale bars: 20 μm. (I) Quantification of the total number of β cells (green bars) at 6 dpf and of β cells that incorporated EdU (yellow bars) during β‐cell regeneration from 4 to 6 dpf. **P < 0.01, ns = non‐significant. n = 16 in both the control and the Tg(bactin:igfbp1a) group.
-
J–L
Tg(ins:kaede);Tg(ins:CFP‐NTR) transgenics, with or without Tg(bactin:igfbp1a), were injected with a control morpholino or a morpholino that knocked down arx, which is necessary for α‐cell differentiation and thus glucagon expression (J, K). Scale bars: 20 μm. (L) Quantification of the total number of regenerating β cells at 4 dpf (after β‐cell ablation at 2–3 dpf). ****P < 0.0001, *P < 0.05, ns=non‐significant. n = 42, 20, 48 and 20, respectively.
Data information: Results are presented as mean values ± SEM and analyzed with two‐way ANOVA.