
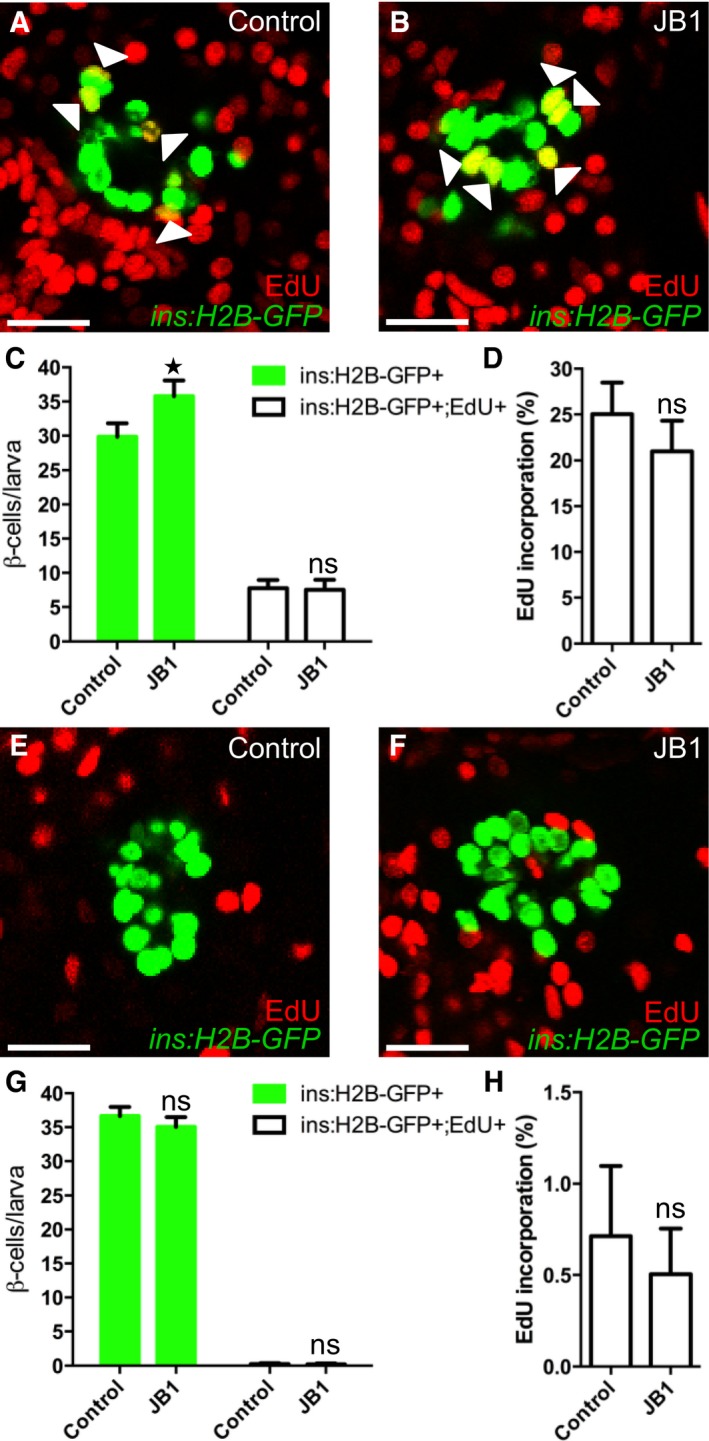
Figure EV3. The IGF1R inhibitor JB1 promotes β‐cell regeneration.
-
A–DTg(ins:H2B‐GFP);Tg(ins:Flag‐NTR) larvae were treated with MTZ from 3 to 4 dpf to ablate the β cells. DMSO or JB1 was then injected into the larval pericardial cavity at 4 dpf, and the larvae were treated with EdU from 4 to 6 dpf. Representative confocal images (A, B) at 6 dpf of DMSO‐ and JB1‐injected larvae, showing β cells in green and the β cells that incorporated EdU as yellow (green and red overlap; see arrowheads). Scale bars: 20 μm. (C) Quantification of the number of all β cells (green bars) and of β cells that incorporated EdU (white bars) per larva at 6 dpf. *P = 0.0422; ns=non‐significant (P = 0.9944). (D) Rate of β‐cell proliferation, shown as the percentage of β cells that incorporated EdU. ns=non‐significant (P = 0.5885). n = 12 larvae in the DMSO‐injected group; n = 19 larvae in the JB1‐injected group.
-
E–HTo determine whether inhibition of Igf signaling affects β‐cell proliferation during regular development, we treated DMSO‐ or JB1‐injected Tg(ins:H2B‐GFP) larvae with EdU in the absence of β‐cell ablation. DMSO or JB1 was injected into pericardial cavity of Tg(ins:H2B‐GFP) larvae at 4 dpf, and the larvae were then treated with EdU from 4 to 6 dpf. Representative confocal images (E, F) at 6 dpf of DMSO‐ and JB1‐injected larvae, showing β cells in green and the cells that incorporated EdU in red. Scale bars: 20 μm. (G) Quantification of the number of all β cells (green bars) and of β cells that incorporated EdU (white bars) from 4 to 6 dpf. ns=non‐significant (P = 0.4088 and 0.9997, respectively). (H) Rate of β‐cell proliferation, shown as the percentage of β cells that incorporated EdU. P = 0.8504. n = 20 larvae in the DMSO‐injected group, n = 27 larvae in the JB1‐injected group.