
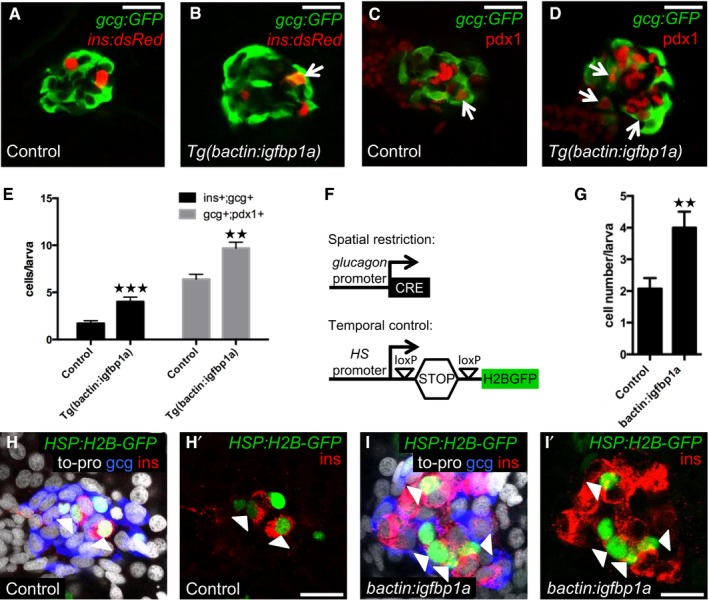
Figure 4. Igfbp1a increases β‐cell regeneration by potentiating α‐ to β‐cell transdifferentiation.
-
A–EControl and Tg(bactin:igfbp1a)‐overexpressing larvae were treated with MTZ from 3 to 4 dpf to ablate β cells and analyzed at 6 dpf, after 2 days of regeneration. Representative confocal images (A, B) of control and Tg(bactin:igfbp1a)‐overexpressing Tg(ins:dsRed);Tg(gcg:GFP);Tg(ins:Flag‐NTR) larvae. A bihormonal glucagon‐ and insulin‐expressing cell (gcg+;ins+) is indicated by an arrow. Representative confocal images (C, D) of control and Tg(bactin:igfbp1a)‐overexpressing Tg(gcg:GFP);Tg(ins:Flag‐NTR) larvae stained for Pdx1. Pdx1‐ and glucagon‐expressing cells (pdx1+;gcg+) are indicated by arrows. Scale bars: 20 μm. (E) Quantification of gcg+;ins+ and pdx1+;gcg+ cells in the control and Tg(bactin:igfbp1a) group; ***P < 0.001, **P = 0.0012; n = 18 and 18 in the control groups, n = 15 and 10 in the Tg(bactin:igfbp1a) groups, for the gcg+;ins+ and pdx1+;gcg+ quantification, respectively.
-
F–ILineage‐tracing evidence supports α‐ to β‐cell transdifferentiation. (F) Schema for temporal and spatial lineage tracing. loxP‐mediated excision of the STOP cassette permits heat‐inducible expression of the stable fusion‐protein H2B‐GFP. Control and bactin:igfbp1a‐overexpressing Tg(hsp:loxP‐mCherry‐STOP‐loxP‐H2B‐GFP);Tg(gcg:CRE);Tg(ins:Flag‐NTR) larvae were first heat‐shocked at 3 dpf to label the glucagon‐expressing cells with the stable fluorescent protein H2B‐GFP, thereafter treated with MTZ from 3 to 4 dpf to ablate the β cells, and analyzed at 6 dpf after 2 days of regeneration. Note that the temporal control of the lineage tracing is mediated by a heat‐shock. (G) Quantification of insulin‐expressing cells that originate from α cells. Control larvae, n = 13; bactin:igfbp1a larvae, n = 16. **P = 0.0051. Representative confocal images (H, I) at 6 dpf (after 2 days of regeneration) of control and bactin:igfbp1a‐overexpressing larvae stained for insulin, glucagon, to‐pro, and H2B‐GFP. ins+;H2B‐GFP+ cells are indicated by the arrowheads, and H' and I' show staining against only insulin and H2B‐GFP. Moreover, most ins+;H2B‐GFP+ cells no longer express glucagon. Scale bars: 15 μm.