
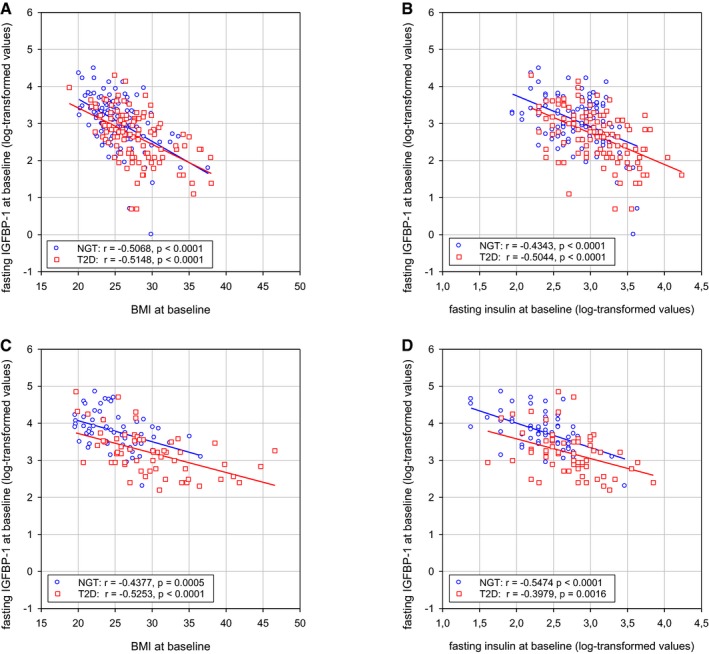
Figure EV4. Correlations of IGFBP1 levels with BMI and insulin levels.
-
A–DCorrelations between baseline levels of fasting IGFBP1 levels and BMI (A, C) or fasting insulin levels (B, D) in men (A, B) and women (C, D). The correlations between these baseline values are significant both in subjects who developed T2D (red squares) and in controls with a normal glucose tolerance (NGT) (blue circles) at follow‐up after 8–10 years. Results are presented as individual values with linear regression. Related to Table 1.