-
A–H
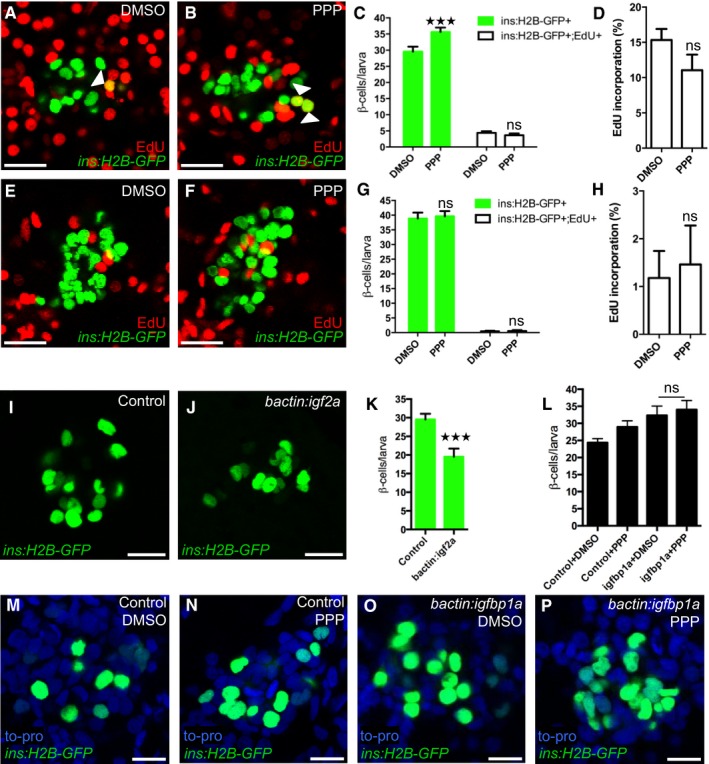
PPP, an IGF1R inhibitor, promotes β‐cell regeneration. Tg(ins:H2B‐GFP);Tg(ins:Flag‐NTR) larvae were treated with MTZ from 3 to 4 dpf to ablate the β cells and then treated with EdU and DMSO or with EdU and PPP during regeneration from 4 to 6 dpf. Representative confocal images (A, B) at 6 dpf of DMSO‐ and PPP‐treated larvae displaying β cells in green and the β cells that had incorporated EdU as yellow overlap (arrowheads). (C) Quantification of the total number of β cells (green bars) at 6 dpf, and β cells that had incorporated EdU (white bars) from 4 to 6 dpf during β‐cell regeneration. ***P = 0.0003, P = 0.8607, respectively. (D) Rate of β‐cell proliferation displayed as the percentage of β cells that incorporated EdU. P = 0.1194. n = 18 larvae for the DMSO‐treated group, n = 17 larvae for the PPP‐treated group. (E–H) To examine whether PPP affected β‐cell proliferation during regular development, Tg(ins:H2B‐GFP) larvae were treated with EdU and DMSO or PPP from 4 to 6 dpf. Representative confocal images (E, F) of 6 dpf DMSO‐ and PPP‐treated larvae displaying β cells in green and the β cells that had incorporated EdU as yellow overlap. Scale bars: 20 μm. (G) Quantification of the total number of β cells (green bars) and β cells that had incorporated EdU (white bars) per larva from 4 to 6 dpf. P = 0.9098 and 0.9976, respectively. (H) Rate of β‐cell proliferation displayed as the percentage of β cells that incorporated EdU. P = 0.7822. n = 16 larvae for DMSO‐treated group, 18 larvae for PPP‐treated group.
-
I–K
Activation of the Igf pathway reduces β‐cell regeneration. Control and bactin:igf2a‐overexpressing Tg(ins:H2B‐GFP);Tg(ins:Flag‐NTR) larvae were treated with MTZ from 3 to 4 dpf to ablate β cells and subsequently let to regenerate from 4 to 6 dpf. Representative confocal images (I, J) of 6 dpf control and bactin:igf2a‐overexpressing larva displaying β cells in green. Scale bars: 15 μm. (K) Quantification of the total number of β cells per larva at 6 dpf following β‐cell regeneration from 4 to 6 dpf. ***P < 0.0001. n = 28 larvae for control, n = 15 larvae for bactin:igf2a.
-
L–P
No synergistic effect was observed for igfbp1a and PPP. Control and bactin:igfbp1a‐overexpressing Tg(ins:H2B‐GFP);Tg(ins:Flag‐NTR) larvae were treated with MTZ from 3 to 4 dpf to ablate β cells and subsequently treated with DMSO or PPP during regeneration from 4 to 6 dpf. (L) Quantification of the total number of β cells per larva. n > 10 (n = 23, 20, 14, 13). P = 0.9546. Representative confocal images (M–P) of 6 dpf control or bactin:igfbp1a overexpressing larvae treated with either DMSO or PPP, displaying β cells after 2 days regeneration. Scale bars: 10 μm.
Data information: Results are presented as mean values ± SEM and analyzed with two‐way ANOVA (C, G),
t‐tests (D, H, K), or one‐way ANOVA (L). See also Figs
EV2 and
EV3.