
Figure 1.
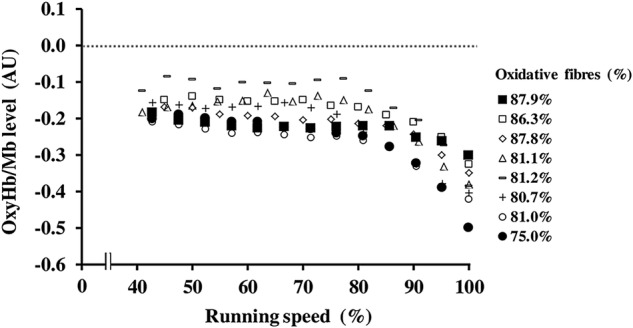
Changes in the levels of oxygenated haemoglobin and myoglobin (oxyHb/Mb) of the vastus lateralis from supine rest (zero) to exhaustion in all participants during the incremental running test (n=8). The data plot legend (right) indicates the percentages of oxidative (types I and IIa) fibres of each participant.