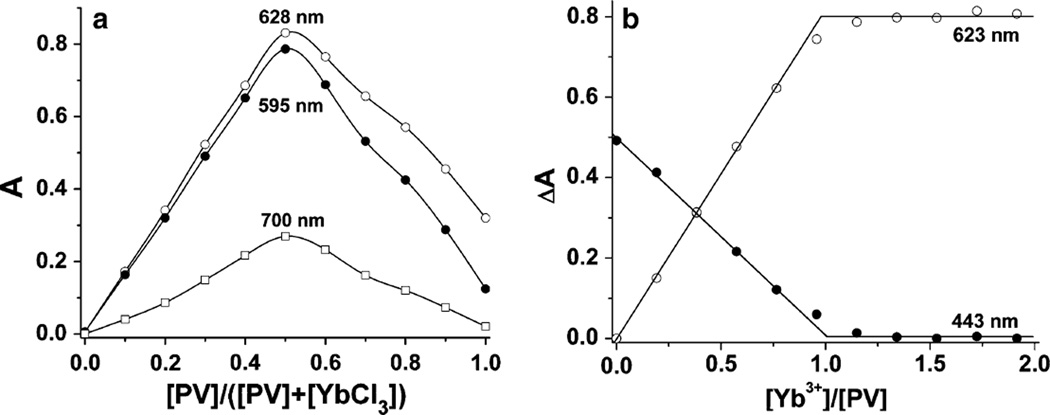
Fig. 3.
a Continuous variation plot at three representative wave-lengths for the Yb3+ and PV system in 10 mM HEPES buffer at pH 7.0. The total concentration of Yb3+ + PV is equal to 100 µM. Samples were prepared by adding the acidic stock solutions to the buffer. b Absorbance difference at 623 and 443 nm as a function of the [Yb3+]/[PV] molar ratio. The PV concentration was kept constant at 50 µM, and Yb3+ was varied from 0 to 100 µM

