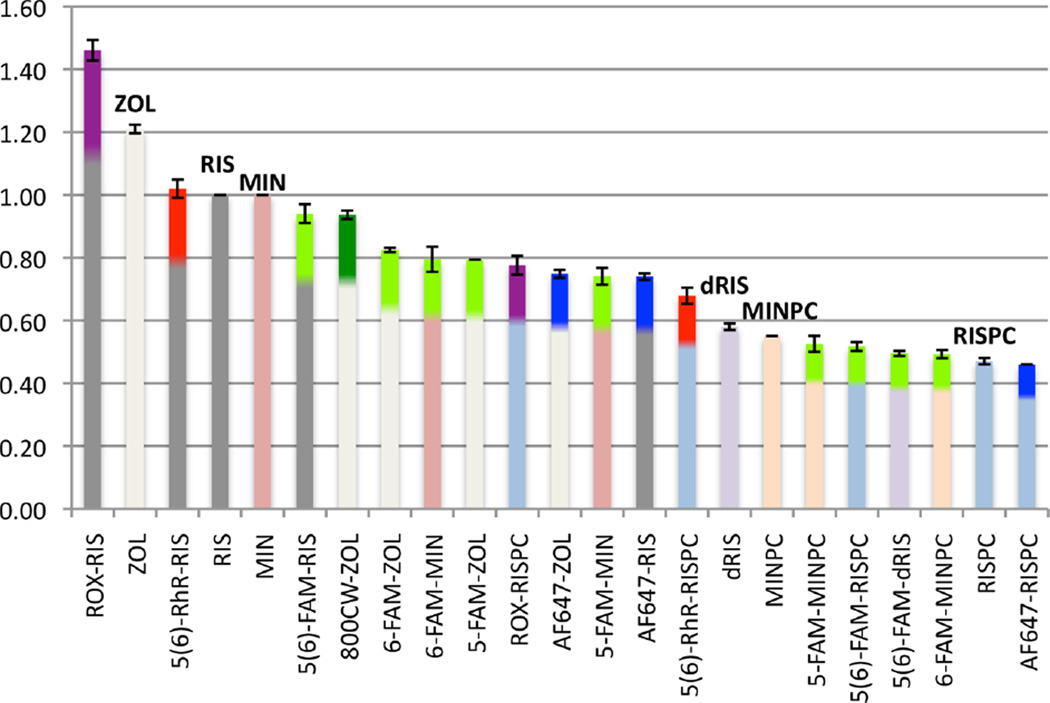
Figure 2.
HAP column binding assay of fluorescent N-BP probes compared to parent N-BP drugs. Data are shown as mean ± SD from three individual studies, as relative retention times normalized to RIS (= 1.00) (p < 0.0001, significant differences between the compounds and RIS were determined by one-way analysis of variance (ANOVA)). The color at the top of each data column represents: Green, FAM conjugates; Red, 5(6)-RhR conjugates; Purple, 5(6)-ROX conjugates; Blue, AF647 conjugates; Dark green, 800CW conjugates.

