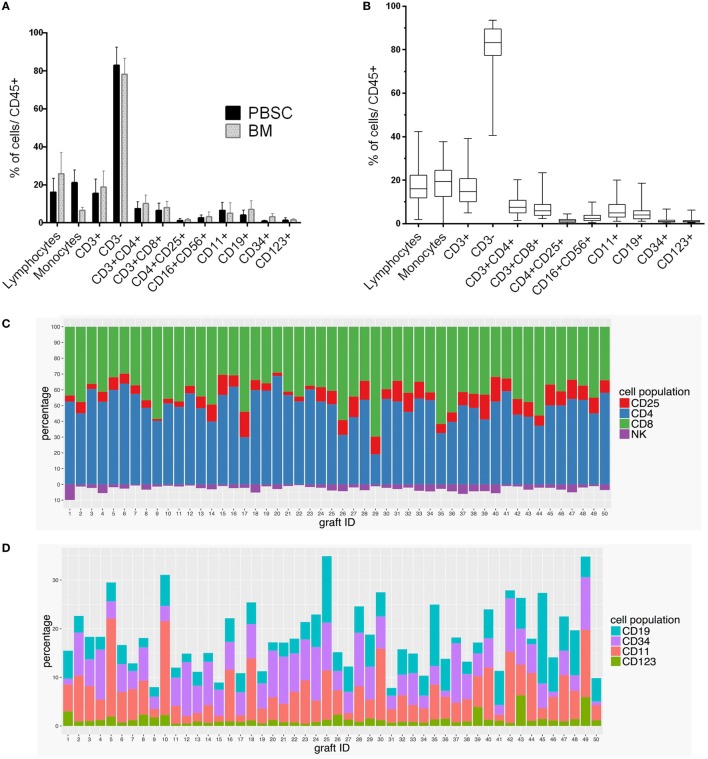
Figure 1.
Variation of immune cell subpopulations in HSCT grafts. The composition of immune cell populations varied (A) among BM and PB grafts and (B) in individual 50 clinical HSCT grafts as measured by the percentages of the cell populations in graft samples. (C) Levels of CD3+, CD4+, CD8+, CD4+ CD25+, CD16+ CD56+ cell subpopulations and (D) CD19+, CD34+, CD11c+, and CD123+ cell subpopulations in each HSCT graft (N = 50) were estimated as percentages out of CD45+ cells. Lymphocytes and monocytes were identified based on their size and granularity.

