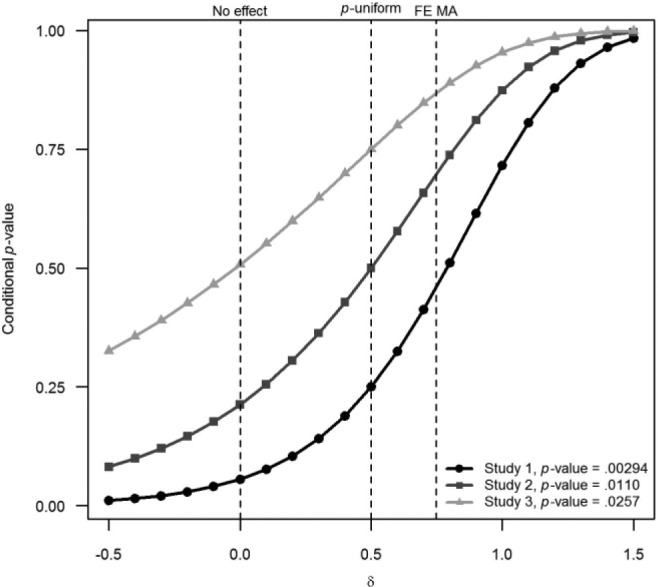
Fig. A3.

Conditional p values as a function of true effect size (x axis) for each of the three observed effect sizes in the example. Effect sizes zero (δ = 0), true effect size (δ = 0.5), and estimated by fixed-effect meta-analysis (δ = 0.748) are indicated by vertical lines.
