Fig. 3.
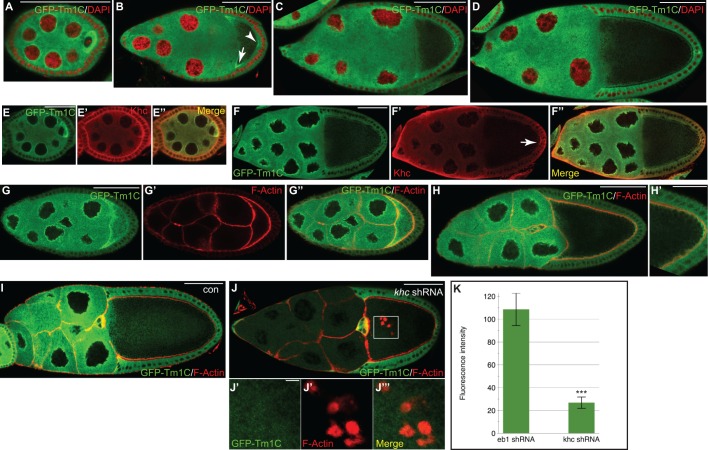
Localization of GFP–Tm1C in the female germline. (A–D) Localization of GFP–Tm1C at various stages of egg chamber maturation. DAPI staining of nuclei is indicated in red. The arrow indicates enrichment of GFP–Tm1C at the anterior of stage 7 oocytes and the arrowhead indicates posterior enrichment. (E,F) Ovaries from the same strain as in A–D were fixed and processed using an antibody against GFP (green, E,F) and Khc (red, E′,F′). A merged image is also shown (E″,F″). The arrow in F′ indicates posterior enrichment of Khc. (G,H) Egg chambers from the same strain were processed using an antibody against GFP and were counterstained with TRITC–phalloidin to visualize F-actin. The GFP–Tm1 signal is depicted in G. The actin signal is depicted in G′ and the merge signal is shown in G″,H and H′. H′ is a magnified view of the posterior pole. (I–J) Egg chambers from strains expressing GFP–Tm1 and either a control shRNA against eb1 (I) or an shRNA against khc (J) were fixed and processed for immunofluorescence using an antibody against GFP. The samples were also counterstained with TRITC– phalloidin. J′–J‴ represent individual and merged images from the boxed region in J. (K) The intensity of the GFP–Tm1 signal in nurse cells of control (eb1 shRNA) or khc-depleted egg chambers was quantified. The results are mean±s.d. (n=25 egg chambers for each genotype). ***P<0.0001 (unpaired t-test). Scale bars: 50 μm (A–D,F,G,H,I,J); 25 μm (E,H′); 5 μm (J′–J‴).

