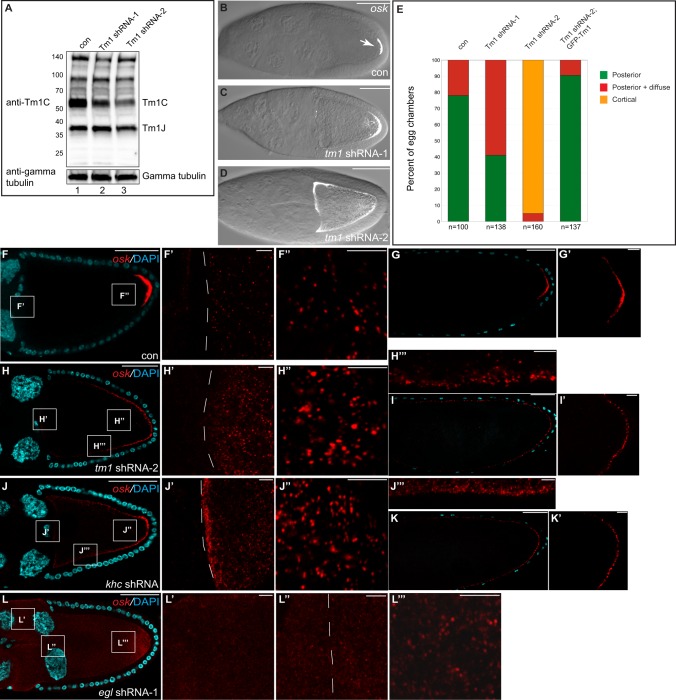
Fig. 4.
Depletion of Tm1C results in osk mRNA delocalization. (A) Ovarian lysates from flies expressing a control shRNA (lane 1), Tm1 shRNA-1 (lane 2) or Tm1 shRNA-2 (lane 3) were analyzed by blotting using an antibody against Tm1C (top panel). This antibody also detects Tm1J. The blot was subsequently stripped and probed with an antibody against γ-tubulin (bottom panel). (B–D) Ovaries from these strains were dissected and processed for single-molecule fluorescence in situ hybridization (smFISH) using oligonucleotide probes against osk mRNA. The osk signal (white) is superimposed over a bright-field image. (E) The localization pattern of osk mRNA was quantified in strains expressing control shRNA, Tm1 shRNA-1 or Tm1 shRNA-2, and a strain co-expressing Tm1 shRNA-2 and the GFP–Tm1C transgene. The number of egg chambers scored is indicated. (F,G) Ovaries from females expressing a control shRNA were processed for smFISH using probes against osk (red). The samples were counterstained with DAPI (cyan). F′ and F″ are enlarged images of boxes in F. A stage 14 egg chamber is shown in G, the posterior of which is enlarged in G′. (H,I) Ovaries from females expressing Tm1 shRNA-2 were processed as above. H′,H″ and H‴ are enlarged images of boxes in H. Panel I is a stage 14 egg chamber and I′ shows an enlargement of the posterior pole. (J,K) Similar layout to the above panels using flies expressing an shRNA against khc. (L) Ovaries from females expressing egl shRNA-1 were processed as above. L′,L″ and L‴ are enlarged images of boxes in L. The dashed line in F′,H′,J′ and L″ indicate the border between nurse cells and the oocyte. Scale bars: 50 μm (B–D,F–L); 5 μm (F′,F″,G′,H′–H‴,I′,J′–J‴,K′,L′–L‴).

