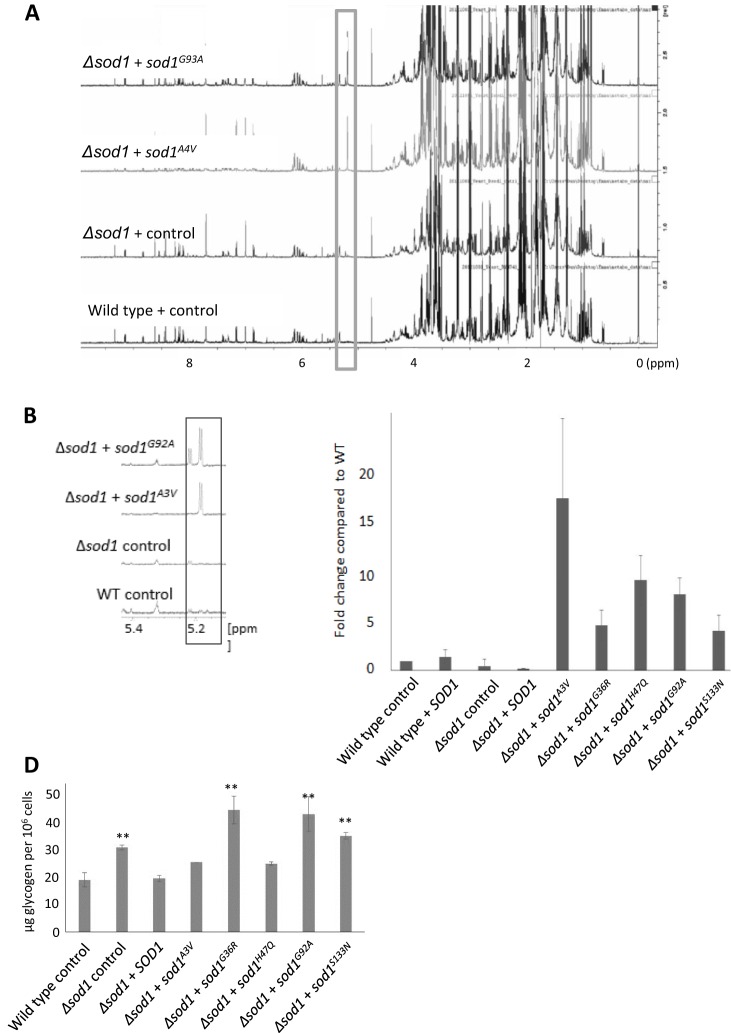
Fig. 6.
Association of SOD1 mutation with metabolic stress. (A,B) Metabolites were extracted and subjected to NMR analyses. The representative 1D H+ spectra display metabolite peaks that highlight the identified trehalose peak, which is enlarged in (B). (C) To confirm the finding, an enzymatic trehalose assay was performed in biological triplicate and the fold change is compared with wild type. (D) Glycogen levels were assessed in triplicate. Error bars represent standard deviation; **P<0.01.

