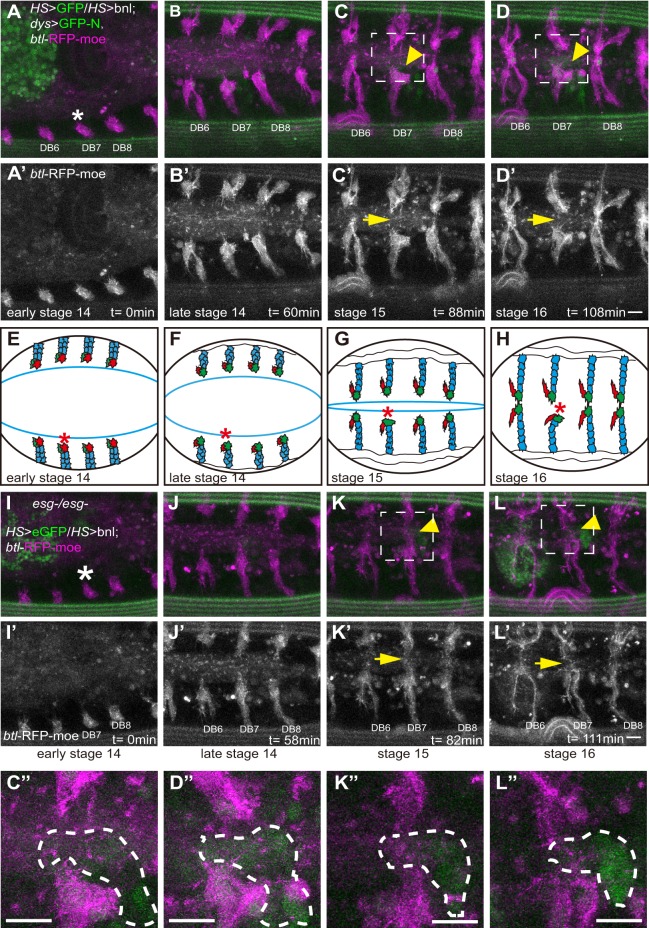
Fig. 6.
Esg modulates Bnl-induced cell migration. (A-D″) Images of HS-eGFP, HS-bnl, dys>GFP-N and btl-RFP-moe embryos showing that the induction of ectopic Bnl inhibits the DB fusion process. (I-L′) Ectopic Bnl was induced in the fusion position in an esg mutant embryo. (A,A′,I,I′) Early stage 14 embryo. The strong green fluorescence is autofluorescence in yolk cells. (B,B′,J,J′) Late stage 14 embryo. (C,C′,K,K′) Stage 15 embryo. (D,D′,L,L′) Stage 16 embryo. (C″,D″,K″,L″) Magnified views of boxed regions in C,D,K,L. The eGFP-positive cell is outlined (dashed line). Arrowheads indicate HS-eGFP. Arrows indicate prospective fusion points. (E-H) Schematics of the DB fusion process, showing FCs (green), TCs (red) and SCs (blue). Asterisks indicate the heat-shock position. The blue line shows the leading edge. Scale bars: 10 µm.

