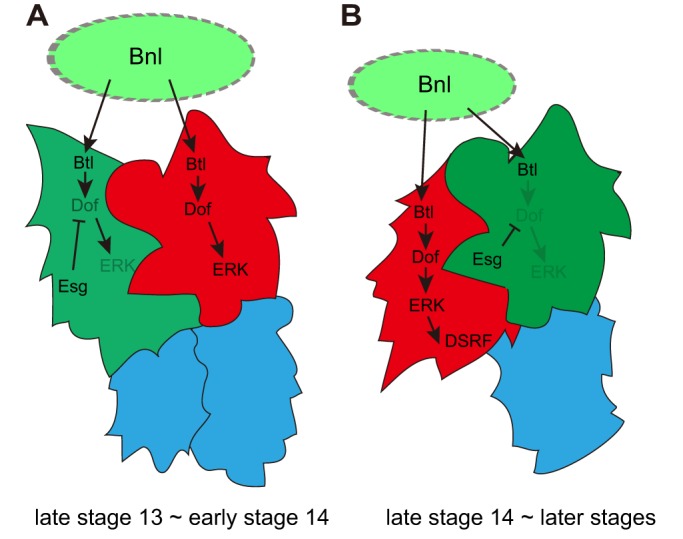
Fig. 7.

Esg coordinates the sequential specification of the FC and TC. Schematics of the regulatory network under FGF (Bnl) signaling and Esg in the DB at late stage 13 to early stage 14 (A) and late stage 14 to subsequent stages (B), showing Esg+ cells (green), dpERK+ cells (red) and SCs (blue).
