Fig. 1.
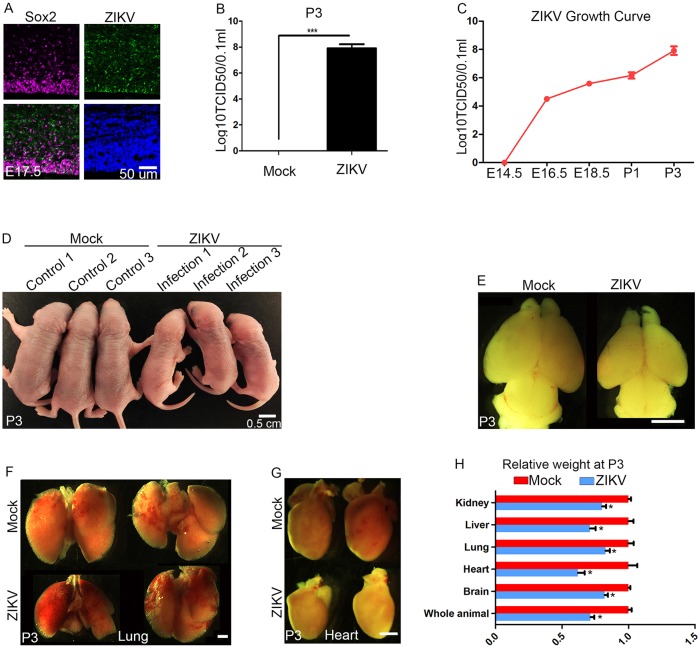
ZIKV causes postnatal microcephaly and growth restriction. (A) Confocal imaging of infected E17.5 cerebral cortex stained with antibodies against Sox2 (labeling NPCs; magenta) and Flavivirus group antigen (ZIKV; green). Hoechst stains nuclei (blue). Scale bar: 50 μm. (B) Viral titers in P3 pup brains were determined using the TCID50 assay. A significantly higher titer of ZIKV (1×109.5 TCID50/ml) was detected in P3 pup brains compared with mock controls. Error bars indicate s.e.m. of three independent measurements with one mock and one ZIKV-infected brain in each measurement (***P<0.0001, Student's t-test). (C) Viral titers were determined in brains at different stages using the TCID50 assay. Error bars indicate the s.e.m. of three independent measurements with one mock and one ZIKV-infected brain in each measurement. Analysis of variance (ANOVA) detects a significant increase in viral titer as development proceeds. (D) Dorsal views of P3 pups. ZIKV (∼1 μl 1.7×10⁶ TCID50/ml) was injected into cerebral ventricles of E14.5 brains followed by analyses at P3. Scale bar: 0.5 cm. (E) ZIKV-infected brains are smaller than controls at P3. Scale bar: 2 mm. (F,G) Dorsal views of P3 hearts and lungs after ZIKV intracerebral inoculation of E14.5 mouse brains. Scale bar: 1 mm. (H) Relative weights of different organs from control or ZIKV-infected pups at P3. Error bars indicate the s.e.m. of six independent experiments with one mock and one ZIKV-infected brain in each experiment (*P<0.01, Student's t-test).

