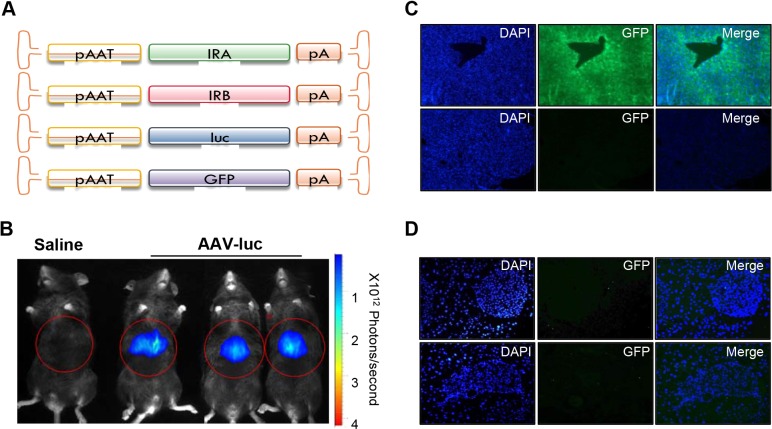
Fig. 3.
In vivo characterization of AAV-GFP- and AAV-luc-injected mice. (A) Schematic diagram of adeno-associated viral (AAV) vectors used in this study. pAAT, human α1-antitrypsin promoter; GFP, green fluorescent protein gene; IRA/B, INSR A or B isoform; ITR, inverted terminal repeat; luc, luciferase gene; polyA, polyadenylation signals. (B) C57BL/6 mice intravenously injected with saline solution (left) or 3×10¹⁰ vg/kg of AAV-luc (right) were analysed by in vivo luciferase imaging 21 days after vector injection with a charge-coupled device (CCD) camera. Optical CCD images for luciferase expression of a representative animal from each group are shown. Liver area is circled in red. (C) Representative immunofluorescences show GFP expression in the liver and (D) pancreas from AAV-GFP-injected mice 15 days after injection with 3×10¹⁰ vg/kg of AAV-GFP (upper panels) and negative control staining of GFP (lower panels). Image magnification: 10× in C, 20× in D.

