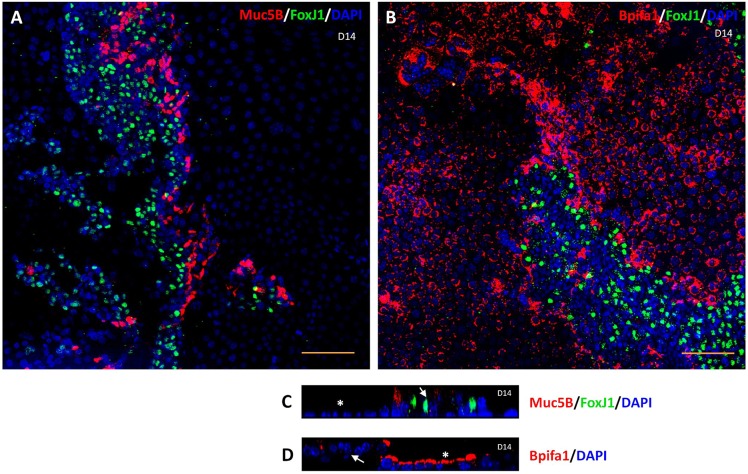
Fig. 5.
Distribution of cell types in mMEC cultures. (A,B) Low-powered (20×) immunofluorescence confocal images representative of three independent batches of ALI day 14 mMEC cultures showing a combination of flat cells and clusters of elevated cells at slightly different foci. Ciliated cells (FoxJ1-positive) do not co-localise with goblet cells (Muc5B-positive) (A) and Bpifa1-expressing cells (B). (C,D) High magnification (60×) cross section z-stack confocal images showing that FoxJ1 and Muc5B expression (C) is mostly restricted to the elevated cell types (arrows) and Bpifa1 (D) is predominantly expressed by flatter cells (asterisk). Scale bars: 100 μm in A,B; 50 μm in C,D.

