Fig. 6.
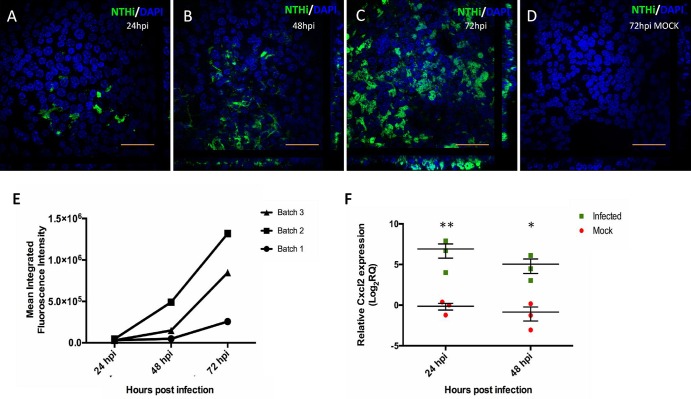
mMEC cultures serve as an otopathogenic infection model. (A-C) High magnification (60×) confocal images representative of three independent batches of ALI day 14 mMECs infected with GFP-tagged NTHi-375SR for 24 h (A), 48 h (B) and 72 h (C) showing a time-dependent increase in bacterial infection. (D) Control ALI day 14 mMECs mock infected for 72 h. Scale bars: 50 μm. (E) Increase in mean green fluorescence intensity from 24 hpi to 72 hpi quantified from lower magnification (10×) images from three independent batches, suggesting an increase in the amount of bacteria infecting the cultures with time. (F) Relative gene expression of Cxcl2 (F) in infected mMEC cultures compared with mock-infected cultures at 24 and 48 hpi. Expression of target gene Cxcl2 was normalised to three endogenous controls; ATP5B, CyC1 and Ppia, and plotted relative to the 24 hpi mock sample. Data was analysed using two tailed Student's t-test and represented as mean relative quantification (RQ)±s.e.m. for three independent batches of cultures. *P<0.05, **P<0.01.

