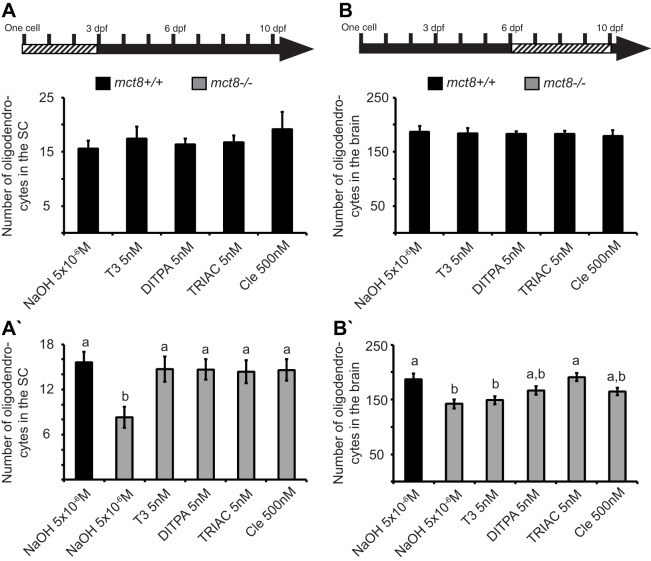
Fig. 4.
TH-analog and clemastine treatments rescue the number of oligodendrocytes in mct8−/− larvae. The arrows at the top of the figure represent the developmental timeline of the experiment. Dashed bar represents the period in which the drug was administered. (A,A′) Number of oligodendrocytes in the spinal cord (SC) of 3-dpf mct8+/+ embryos treated with T3 (n=11), DITPA (n=12), TRIAC (n=11), clemastine (Cle, n=10) or NaOH (n=16), and mct8−/− embryos treated with T3 (n=12), DITPA (n=14), TRIAC (n=14), clemastine (Cle, n=12) or NaOH (n=16) (P<0.01 for ‘a’ and ‘b’). (B,B′) Number of oligodendrocytes in the brain of 10-dpf mct8+/+ larvae treated with T3 (n=10), DITPA (n=11), TRIAC (n=11), clemastine (Cle, n=10) or NaOH (n=10), and mct8−/− larvae treated with T3 (n=10), DITPA (n=12), TRIAC (n=11), clemastine (Cle, n=15) or NaOH (n=13, P<0.001 for ‘a’ and ‘b’). Values represented as means±s.e.m. Statistical significance determined by one-way ANOVA, followed by post-hoc Tukey HSD test. The letters above the bars indicate significant differences.

