Figure 5.

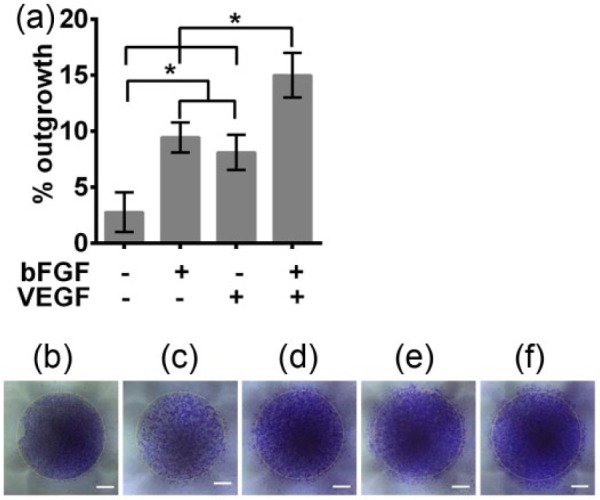
HUVEC migration in response to growth factor releasing hydrogels was monitored via an outgrowth assay. HUVECs were plated confluently within a fence and after fence removal transwells with PVA-heparin hydrogels containing no growth factor, 500 ng/mL bFGF, 500 ng/mL VEGF or 500 ng/mL bFGF, and 500 ng/mL VEGF were placed above the cells and the HUVECs were cultured for 24 h. Cells were stained with crystal violet and imaged and compared to the initial time point (0 h). (a) HUVEC outgrowth was quantified as a percent increase in area over 24 h. Significant differences are noted by an asterisk (*p < 0.05). (b) Initial confluent cell monolayer (0 h). Cell coverage after 24 h in the presence of PVA-heparin gels containing (c) no growth factor, (d) 500 ng/mL bFGF, (e) 500 ng/mL VEGF, or (f) 500 ng/mL bFGF and 500 ng/mL VEGF. Scale bars are 2 mm. Yellow dashed line indicate the initial cell coverage area.
