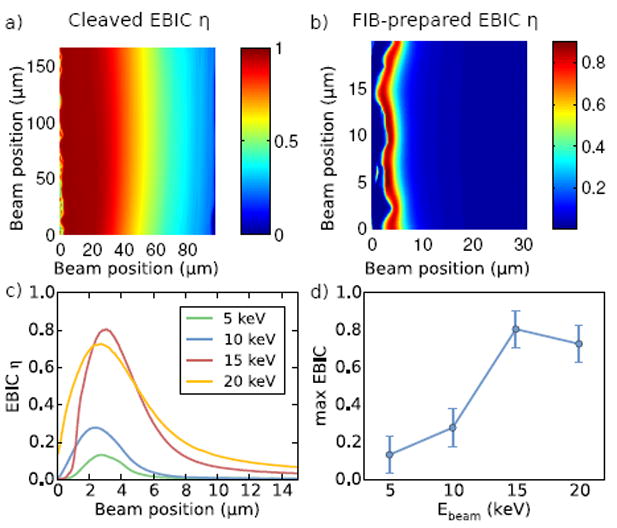
Fig. 2.

(a) EBIC collection efficiency map for the cleaved sample at beam energy of 15 keV. The n-contact is at the left-hand side. (b) The same data for the FIB-prepared sample. (c) EBIC collection efficiency versus beam position for FIB’d Si samples, for beam energies of (5,10,15, 20) keV, (d) the corresponding maximum collection efficiency versus beam energy.
