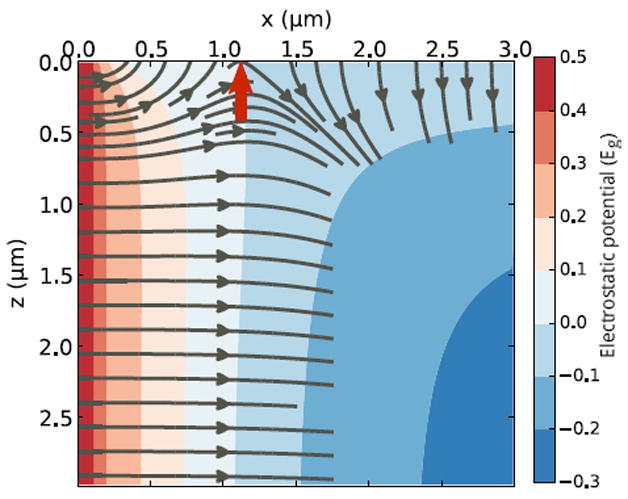
Fig. 5.

Numerically computed electrostatic potential in units of the band gap energy as a function of 2-d position in the depletion region. z = 0 corresponds to the surface, at which the potential is pinned to the midgap surface defect level (white). The gray lines are electric field lines showing the direction of the local electric field. The red arrow indicates the position x0 at which the surface energy level equals the bulk p-n junction Fermi level.
