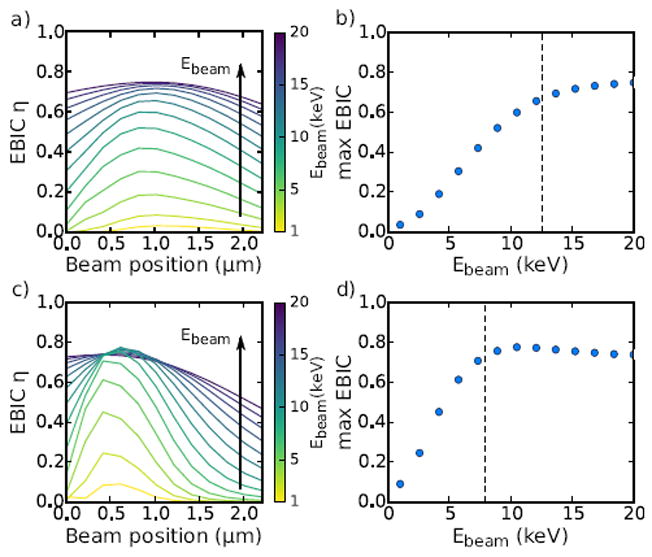
Fig. 8.

(a) EBIC lineshapes as a function of beam positions for values of Ebeam equally spaced between 1 and 20 keV. The arrow indicates the direction of increasing electron beam energy. Bulk doping is NA = 1014 cm−3, defect energy level is at midgap, and Nsurf = 1011 cm−2. (b) Maximum EBIC efficiency as a function of Ebeam. The vertical line corresponds to the beam energy for which the associated excitation bulb size is equal to the surface depletion width. (c), (d) Same data as (a) and (b) for an increased value of doping, NA = 5 × 1014 cm−3.
