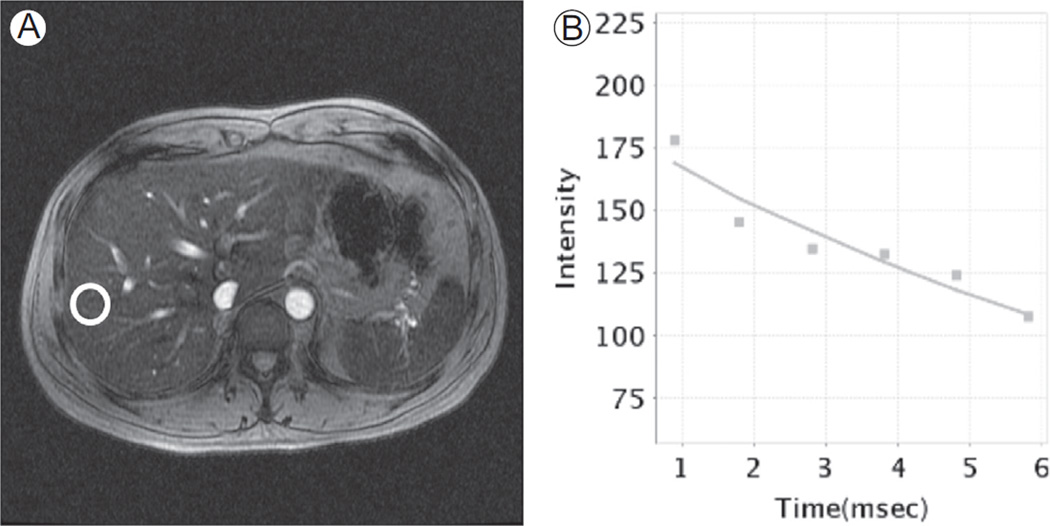
Figure 8.
Iron quantification with concomitant liver steatosis. (A) Axial T2*-weighted image from a multiecho T2* GRE (TR = 43 milliseconds, TE = 13 milliseconds). A free-hand ROI is placed in the liver parenchyma, avoiding visible vessels. (B) In this subject, a sinusoidal signal decay with poor fitting of measurements with exponential curve is characteristic of concomitant presence of liver steatosis and iron overload. Liver steatosis reduces accuracy in iron estimation. ROI, region of interest.

