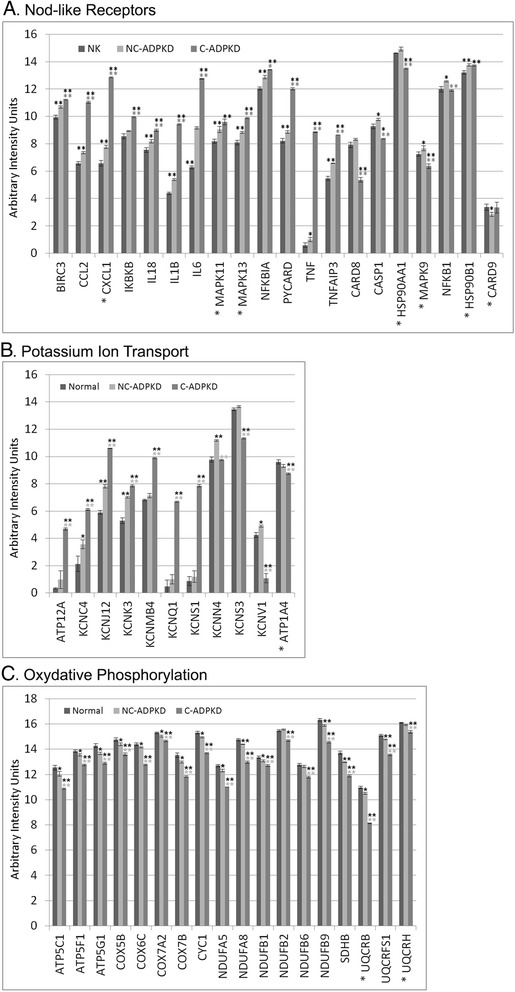
Fig. 15.

Comparisons of individual gene expression levels for genes selected from differentially expressed gene sets. a NOD-like receptor signaling, b potassium ion transport, and c oxidative phosphorylation. To simplify presentation of these gene sets, where we used two or more probes in the microarray for a single gene, we give mean values and mark the gene names with an “asterisk”. Within gene sets, we can discern changes in individual genes responsible for differential expression of the pathways. We present data as mean ± s.e.m., **P < 0.01, *P < 0.05 (black asterisk is in comparison to NK, gray asterisk is in comparison to NC-ADPKD). Additional file 4 provides additional information on each gene
