Fig. 1.

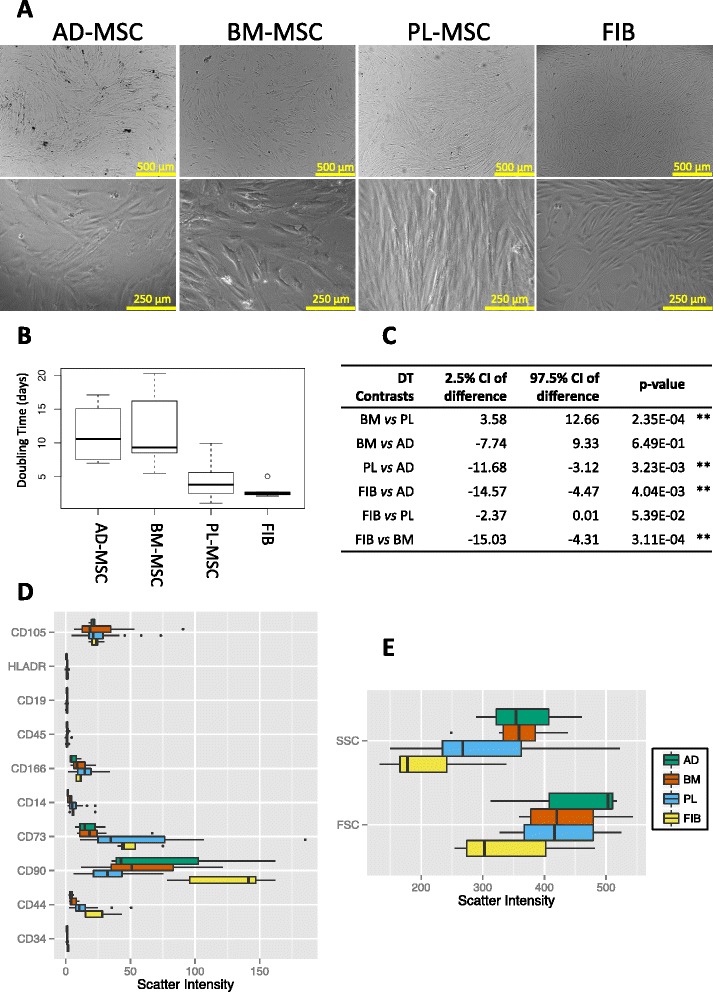
Characterization of MSCs following the ISCT criteria. a Microscope photographs of human stromal cells in culture taken at passage three: phase contrast micrographs seen at 4× and 10×. b-c Analysis of population doubling times: b boxplot of the doubling time distributions per stromal cell culture; c Wilcoxon test results of contrasted doubling times between stromal types. (DT = Doubling Time; W = Wilcoxon Test; CI = Confidence Interval). Labels for stromal cell types: AD = Adipose tissue MSC; BM = Bone marrow MSC; PL = Placental MSC; FIB = Dermal fibroblasts. **Significant p-values under 0.05. d-e Boxplots of normalized scatter intensities collected from flow-cytometry immunophenotyping assays using 10 different markers: CD105, HLADR, CD19, CD45, CD166, CD14, CD73, CD90, CD44 and CD34. (SSC = side scatter; FSC = forward scatter)
