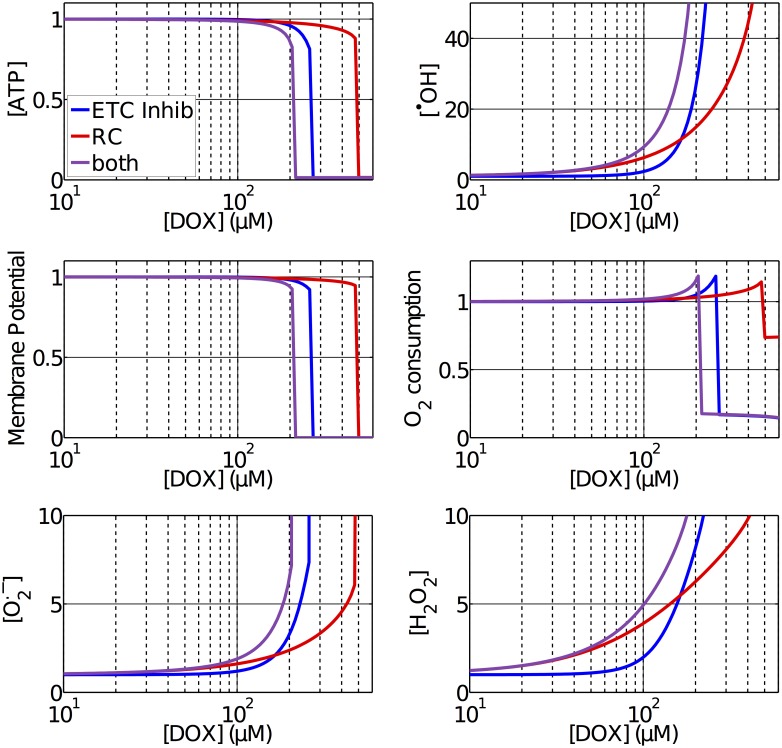
Fig 2. Normalized variation of different indices of mitochondrial function with respect to acute concentrations of DOX in the mitochondria.
A constant concentration of DOX was used as an input and simulations were performed until steady state. It is possible to compare the effects of ETC inhibition, redox cycling (RC) and both combined.

