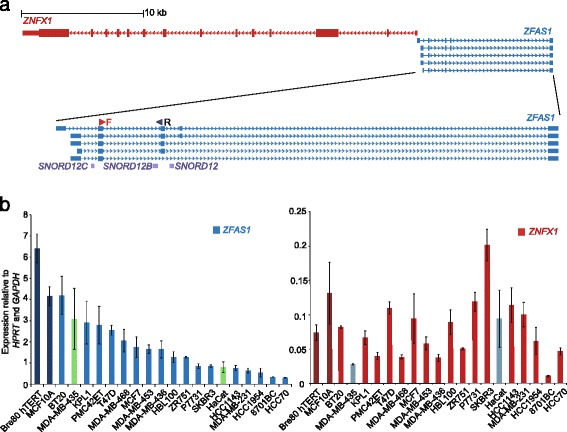
Fig. 1.

Genomic orientation of ZFAS1 and ZNFX1 and their expression. a Genomic orientation of ZFAS1 in relation to ZNFX1 derived from the UCSC Genome Browser genome assembly Mar 2006 (NCBI36/hg18). The enlarged figure of ZFAS1 shows the location of the three snoRNAs in three consecutive introns. b Expression of ZFAS1 (left) and ZNFX1 (right) in cell lines relative to that of HPRT and GAPDH. Dark blue and dark red bars indicate normal breast epithelial cell lines, normal coloured bars indicate breast cancer cell lines. Green and grey coloured bars indicate non-breast cancer cell lines (MDA-MB-435 and HaCat are melanoma and keratinocyte cell lines respectively). ZNFX1 and ZFAS1 expression showed no correlation. Expression levels were analysed in 3 biological replicates, error bars represent SEM. Primers used for qPCR are shown in panel a (forward (F) and reverse (R) primers on exons 2 and 3 respectively)
