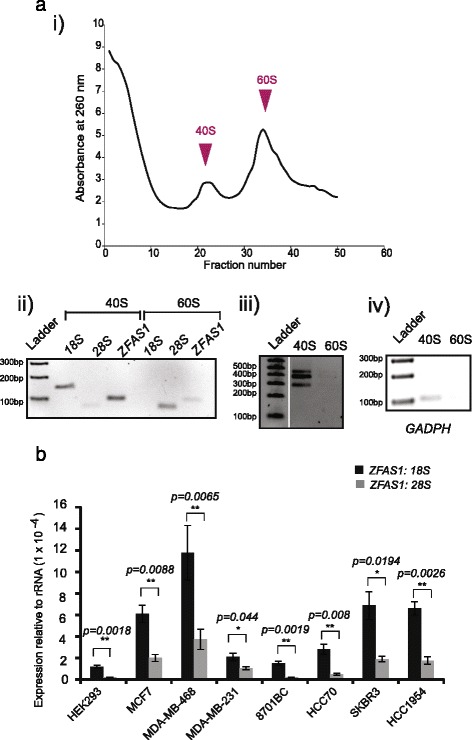
Fig. 4.

ZFAS1 is predominantly associated with the small ribosomal subunit. a (i) Ribosomal subunit profile of MDA-MB-468 cells. The Y and X axes represent the A260 and fraction numbers respectively. Sample 1 is from the top of the gradient while 50 is the bottom fraction. (ii) ZFAS1 RT-PCR products using primers as described in Fig. 1 from each peak, fractions 22 and 34. 18S and 28S rRNA are used to indicate the small and large subunit distribution in the gradient. (iii) ZFAS1 RT-PCR products using primers E1F3-E5R1 from each peak, showing that ZFAS1 is expressed with the 40S subunit in an isoform-independent manner. (iv) GAPDH RT-PCR products from each peak, used as a positive control. b Ratio of ZFAS1 to 18S and 28S rRNA in different cell lines. qPCR was performed on extracts from various cell lines and expression of ZFAS1 relative to 18S and 28S rRNA was calculated. Error bars represent SEM of 3 biological replicates; p values were calculated using the Mann–Whitney test
