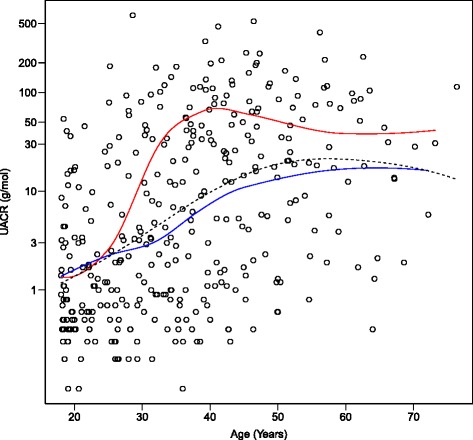
Fig. 2.

Effect of ACE insertion-deletion genotype on cross-sectional relationship between age and UACR. Upper curve is D/I genotype group; lower, the I/I genotype group; the dotted line is the overall curve (Flattening of D/I curve after the age of 40 may reflect selective mortality, but there may be other cohort effects acting)
